Notes
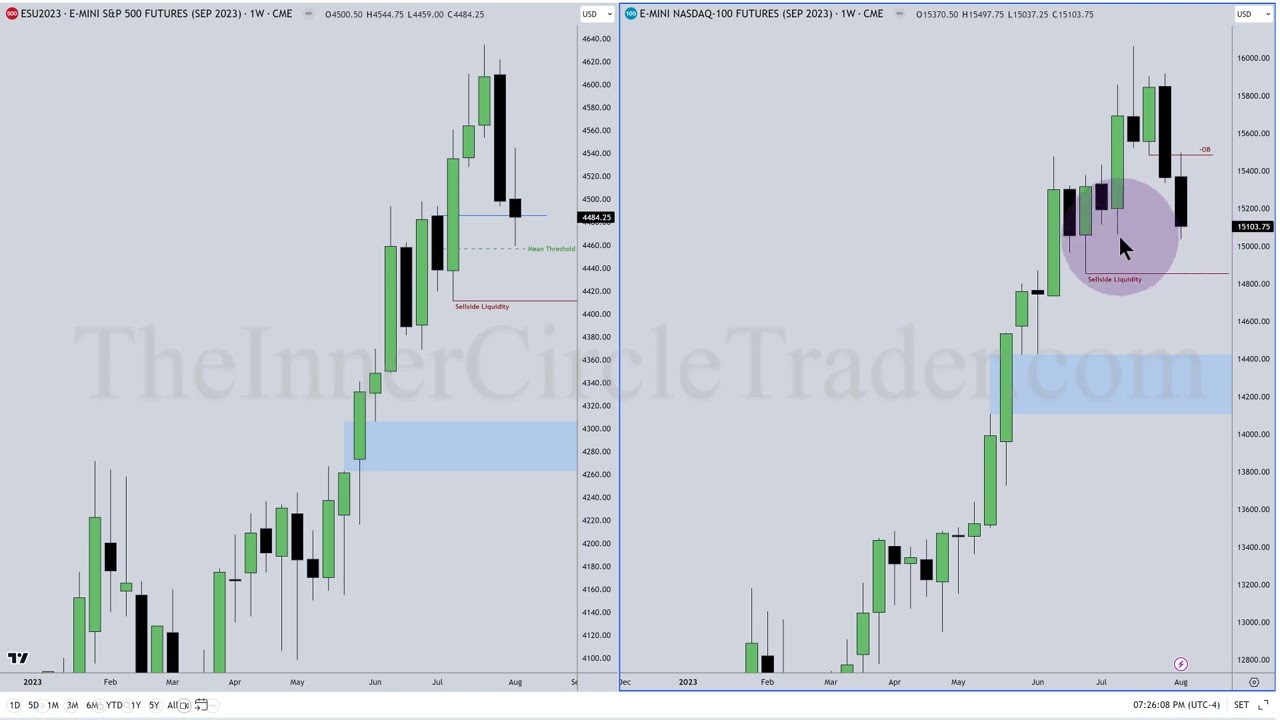
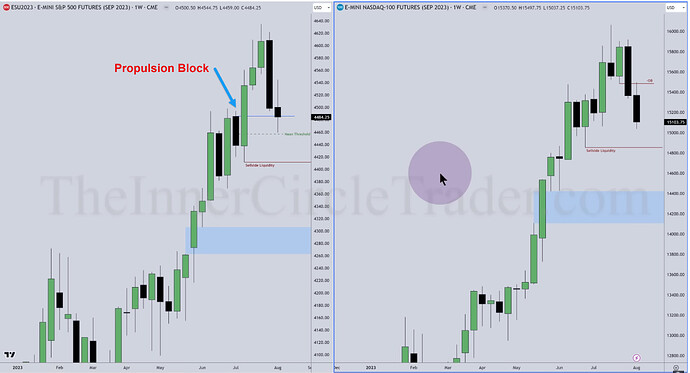
- If the price closes below the Mean Threshold of the bullish Propulsion Block, it is an extremely bearish sign.
- If the price closes above the Mean Threshold of the bearish Propulsion Block, it is an extremely bullish sign.
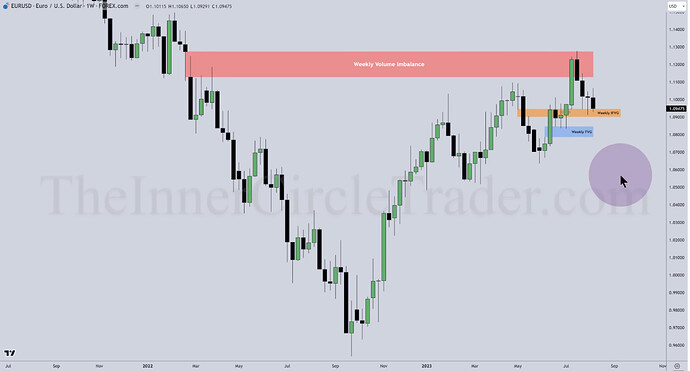
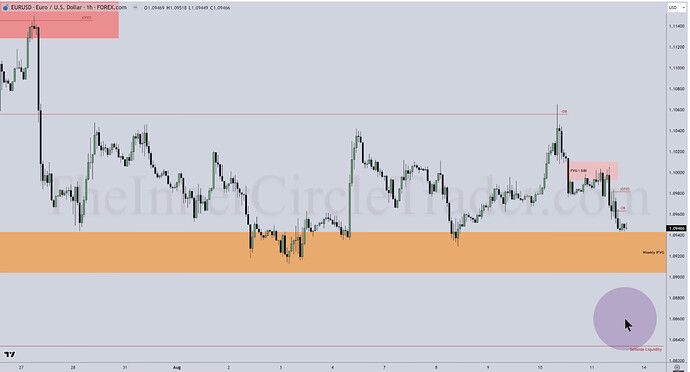
EURUSD - Weekly Chart
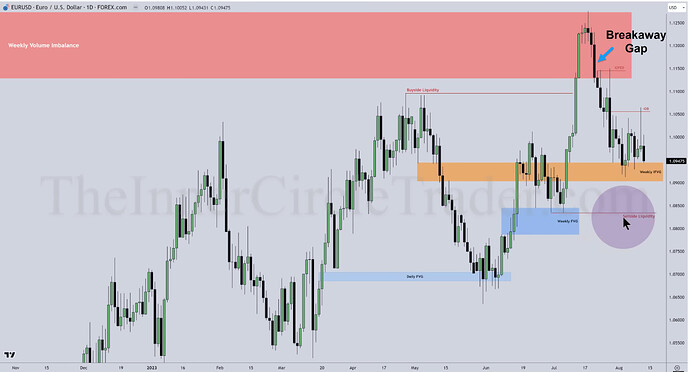
EURUSD - Breakaway Gap And IOFED
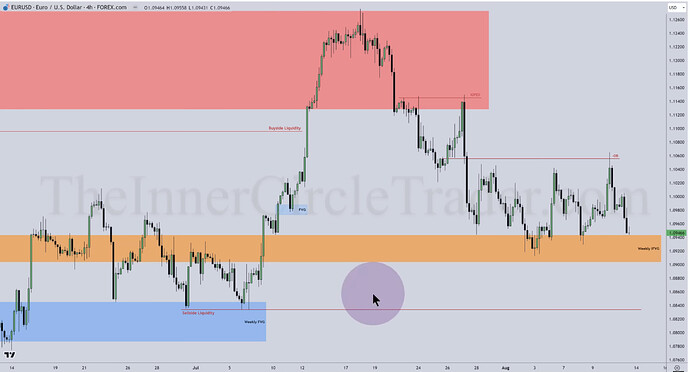
EURUSD - 4-Hour Chart
EURUSD - FVG (SIBI), IOFED And Bearish Order Block
ES And NQ - Propulsion Block
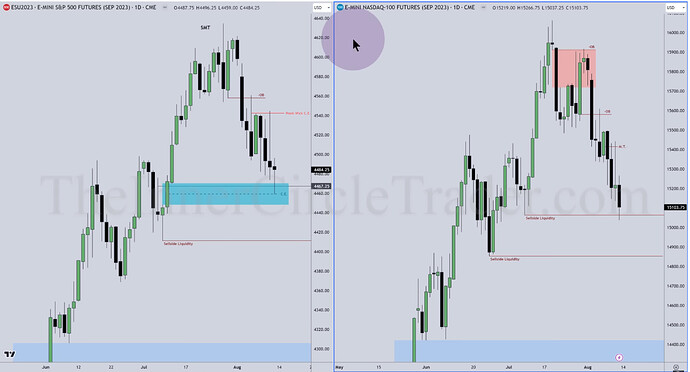
ES And NQ - Wick’s Consequent Encroachment And Mitigation Block Of Bearish Order Block
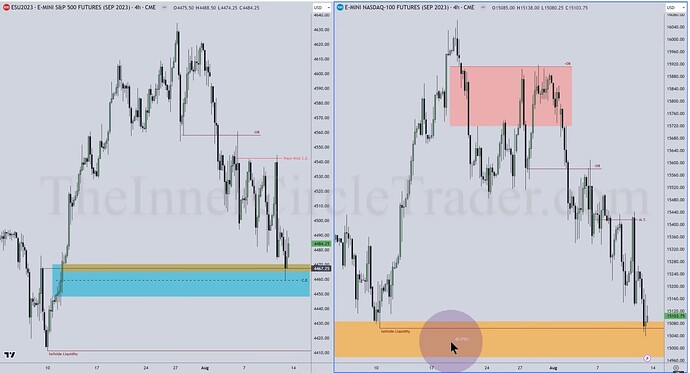
ES And NQ - 4-Hour Chart
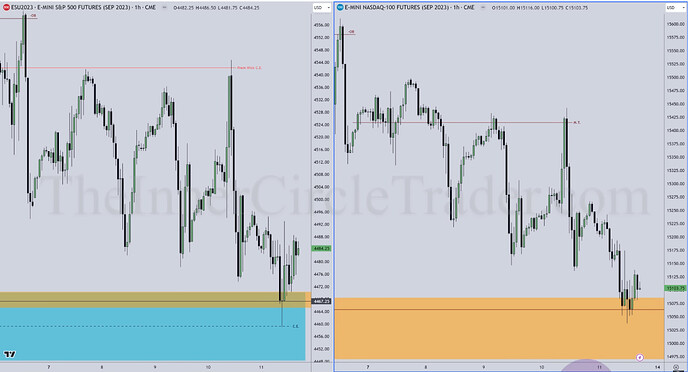
ES And NQ - Hourly Chart
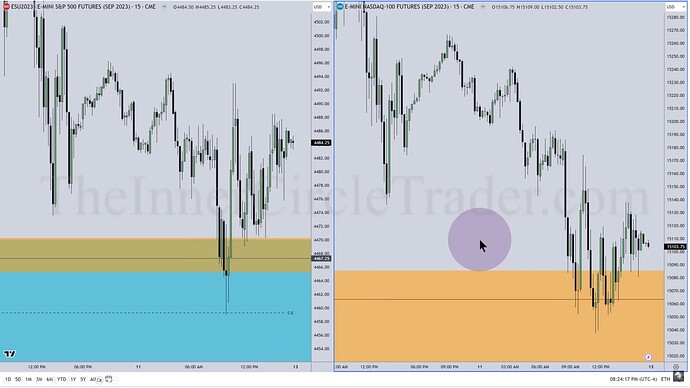
ES And NQ - 15-Minute Chart
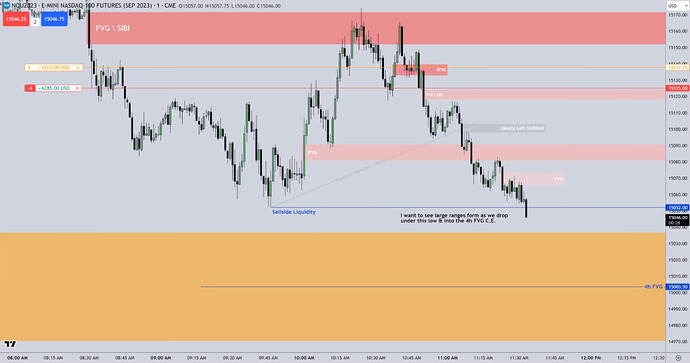
NQ Trade Example - Inversion Fair Value Gap
Next lesson: 2023 ICT Mentorship - NQ Futures Review: August 14
Previous lesson: 2023 ICT Mentorship - Proper Learning & The Importance Of Journaling
