
Notes
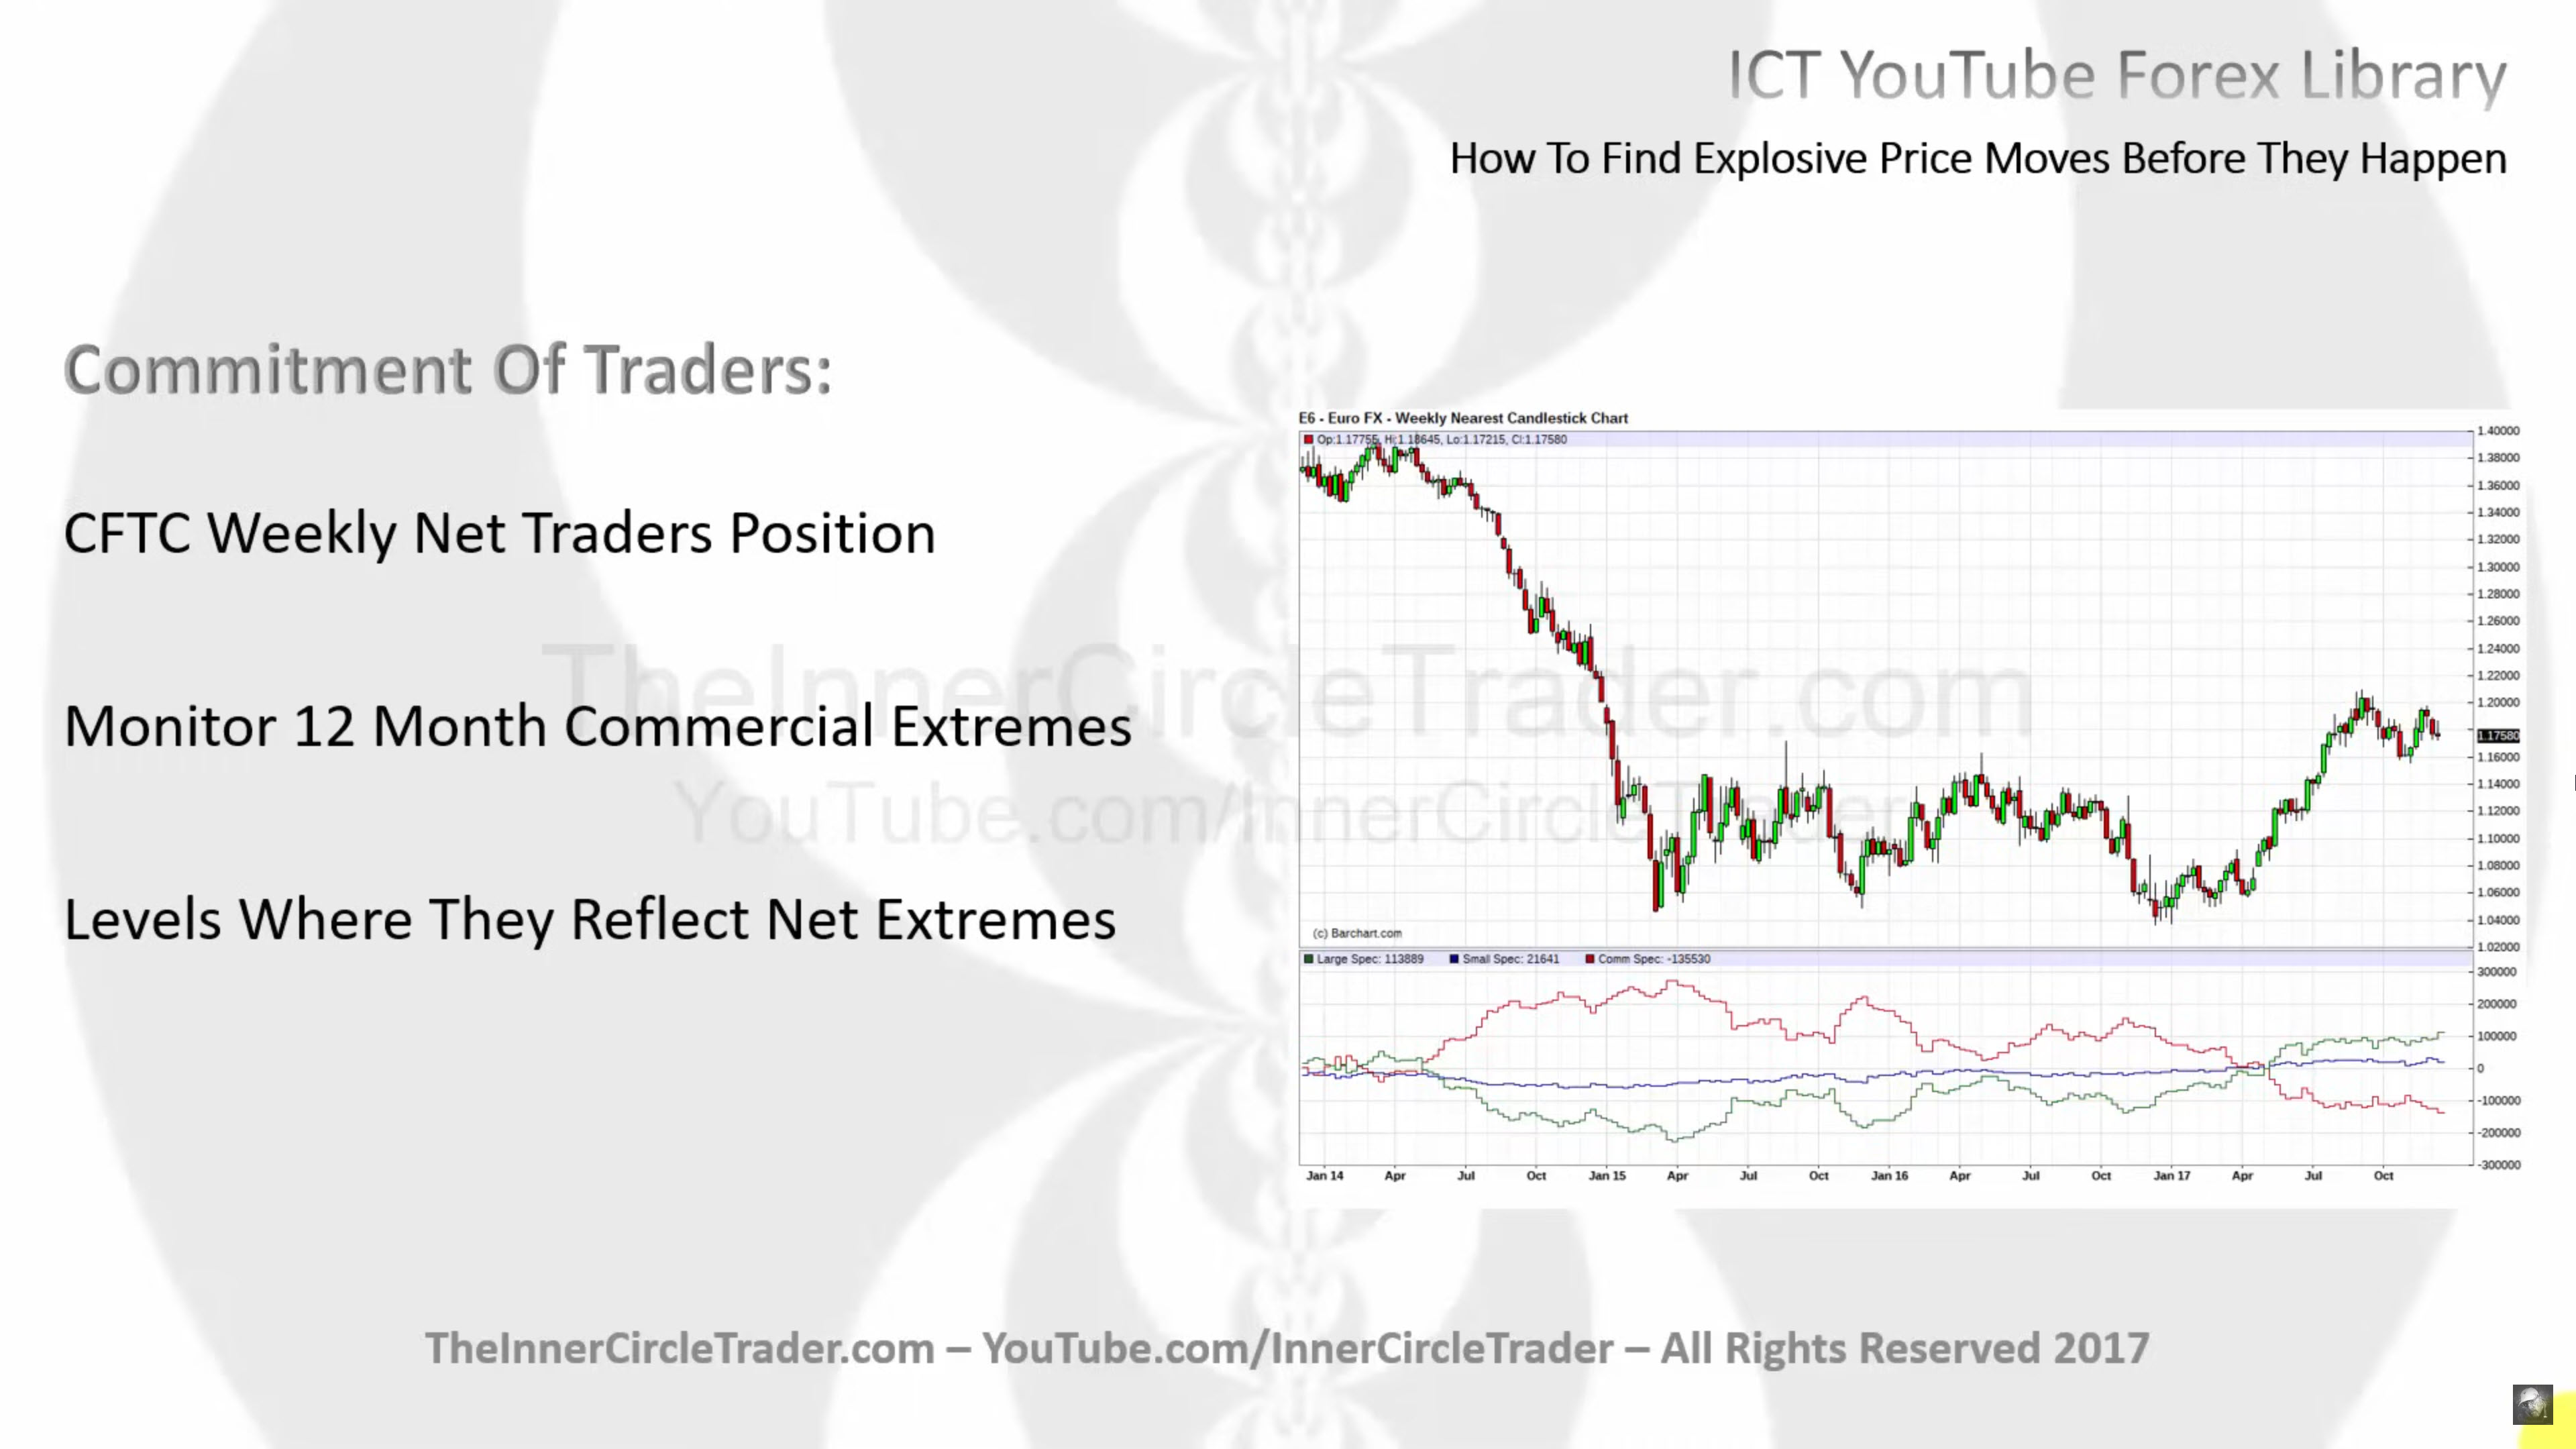
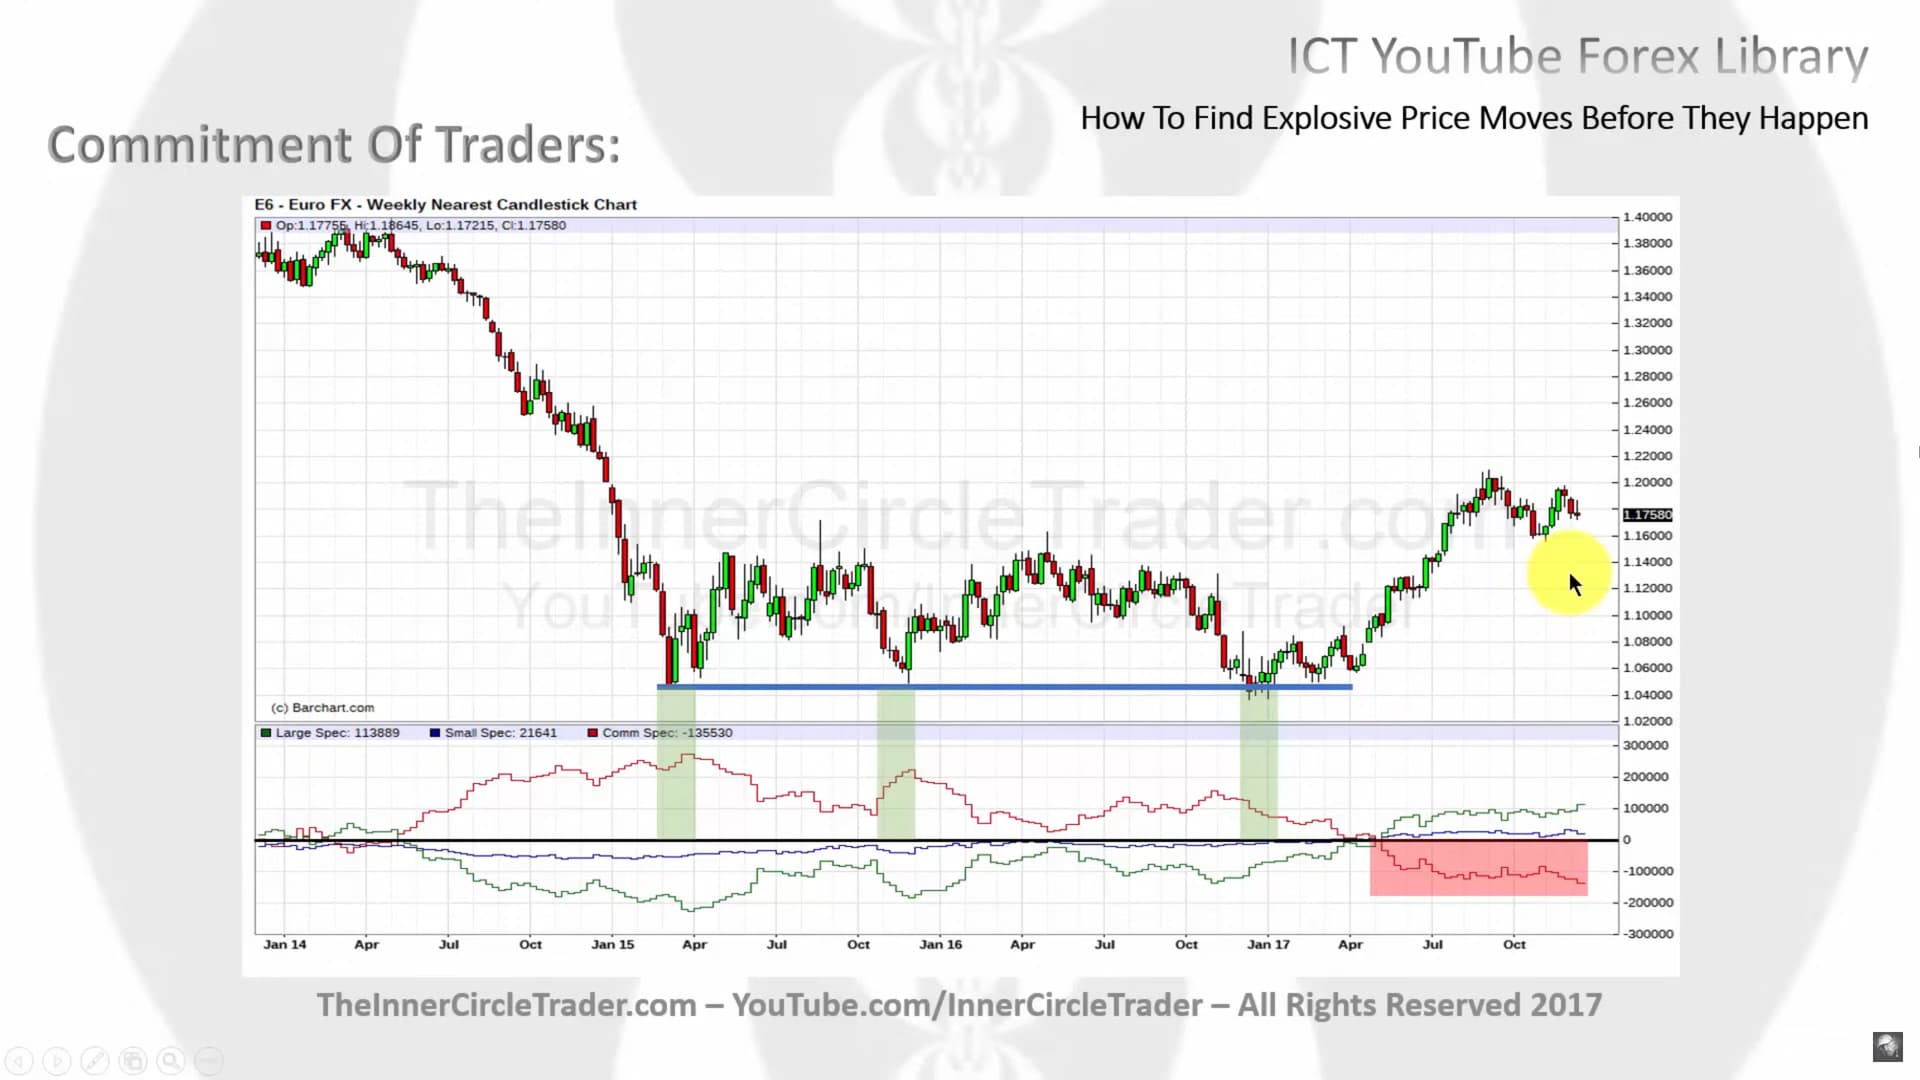
- The COT chart is used to identify support and resistance on higher time frames using commercial extremes.
- The zero line in the COT chart helps delineate traders’ positions. Above it indicates buying, and below it indicates selling.
- Commercials often take positions opposite to large speculators.
- A long period of buying by commercials followed by a rally can suggest upcoming resistance. The opposite is true for support.
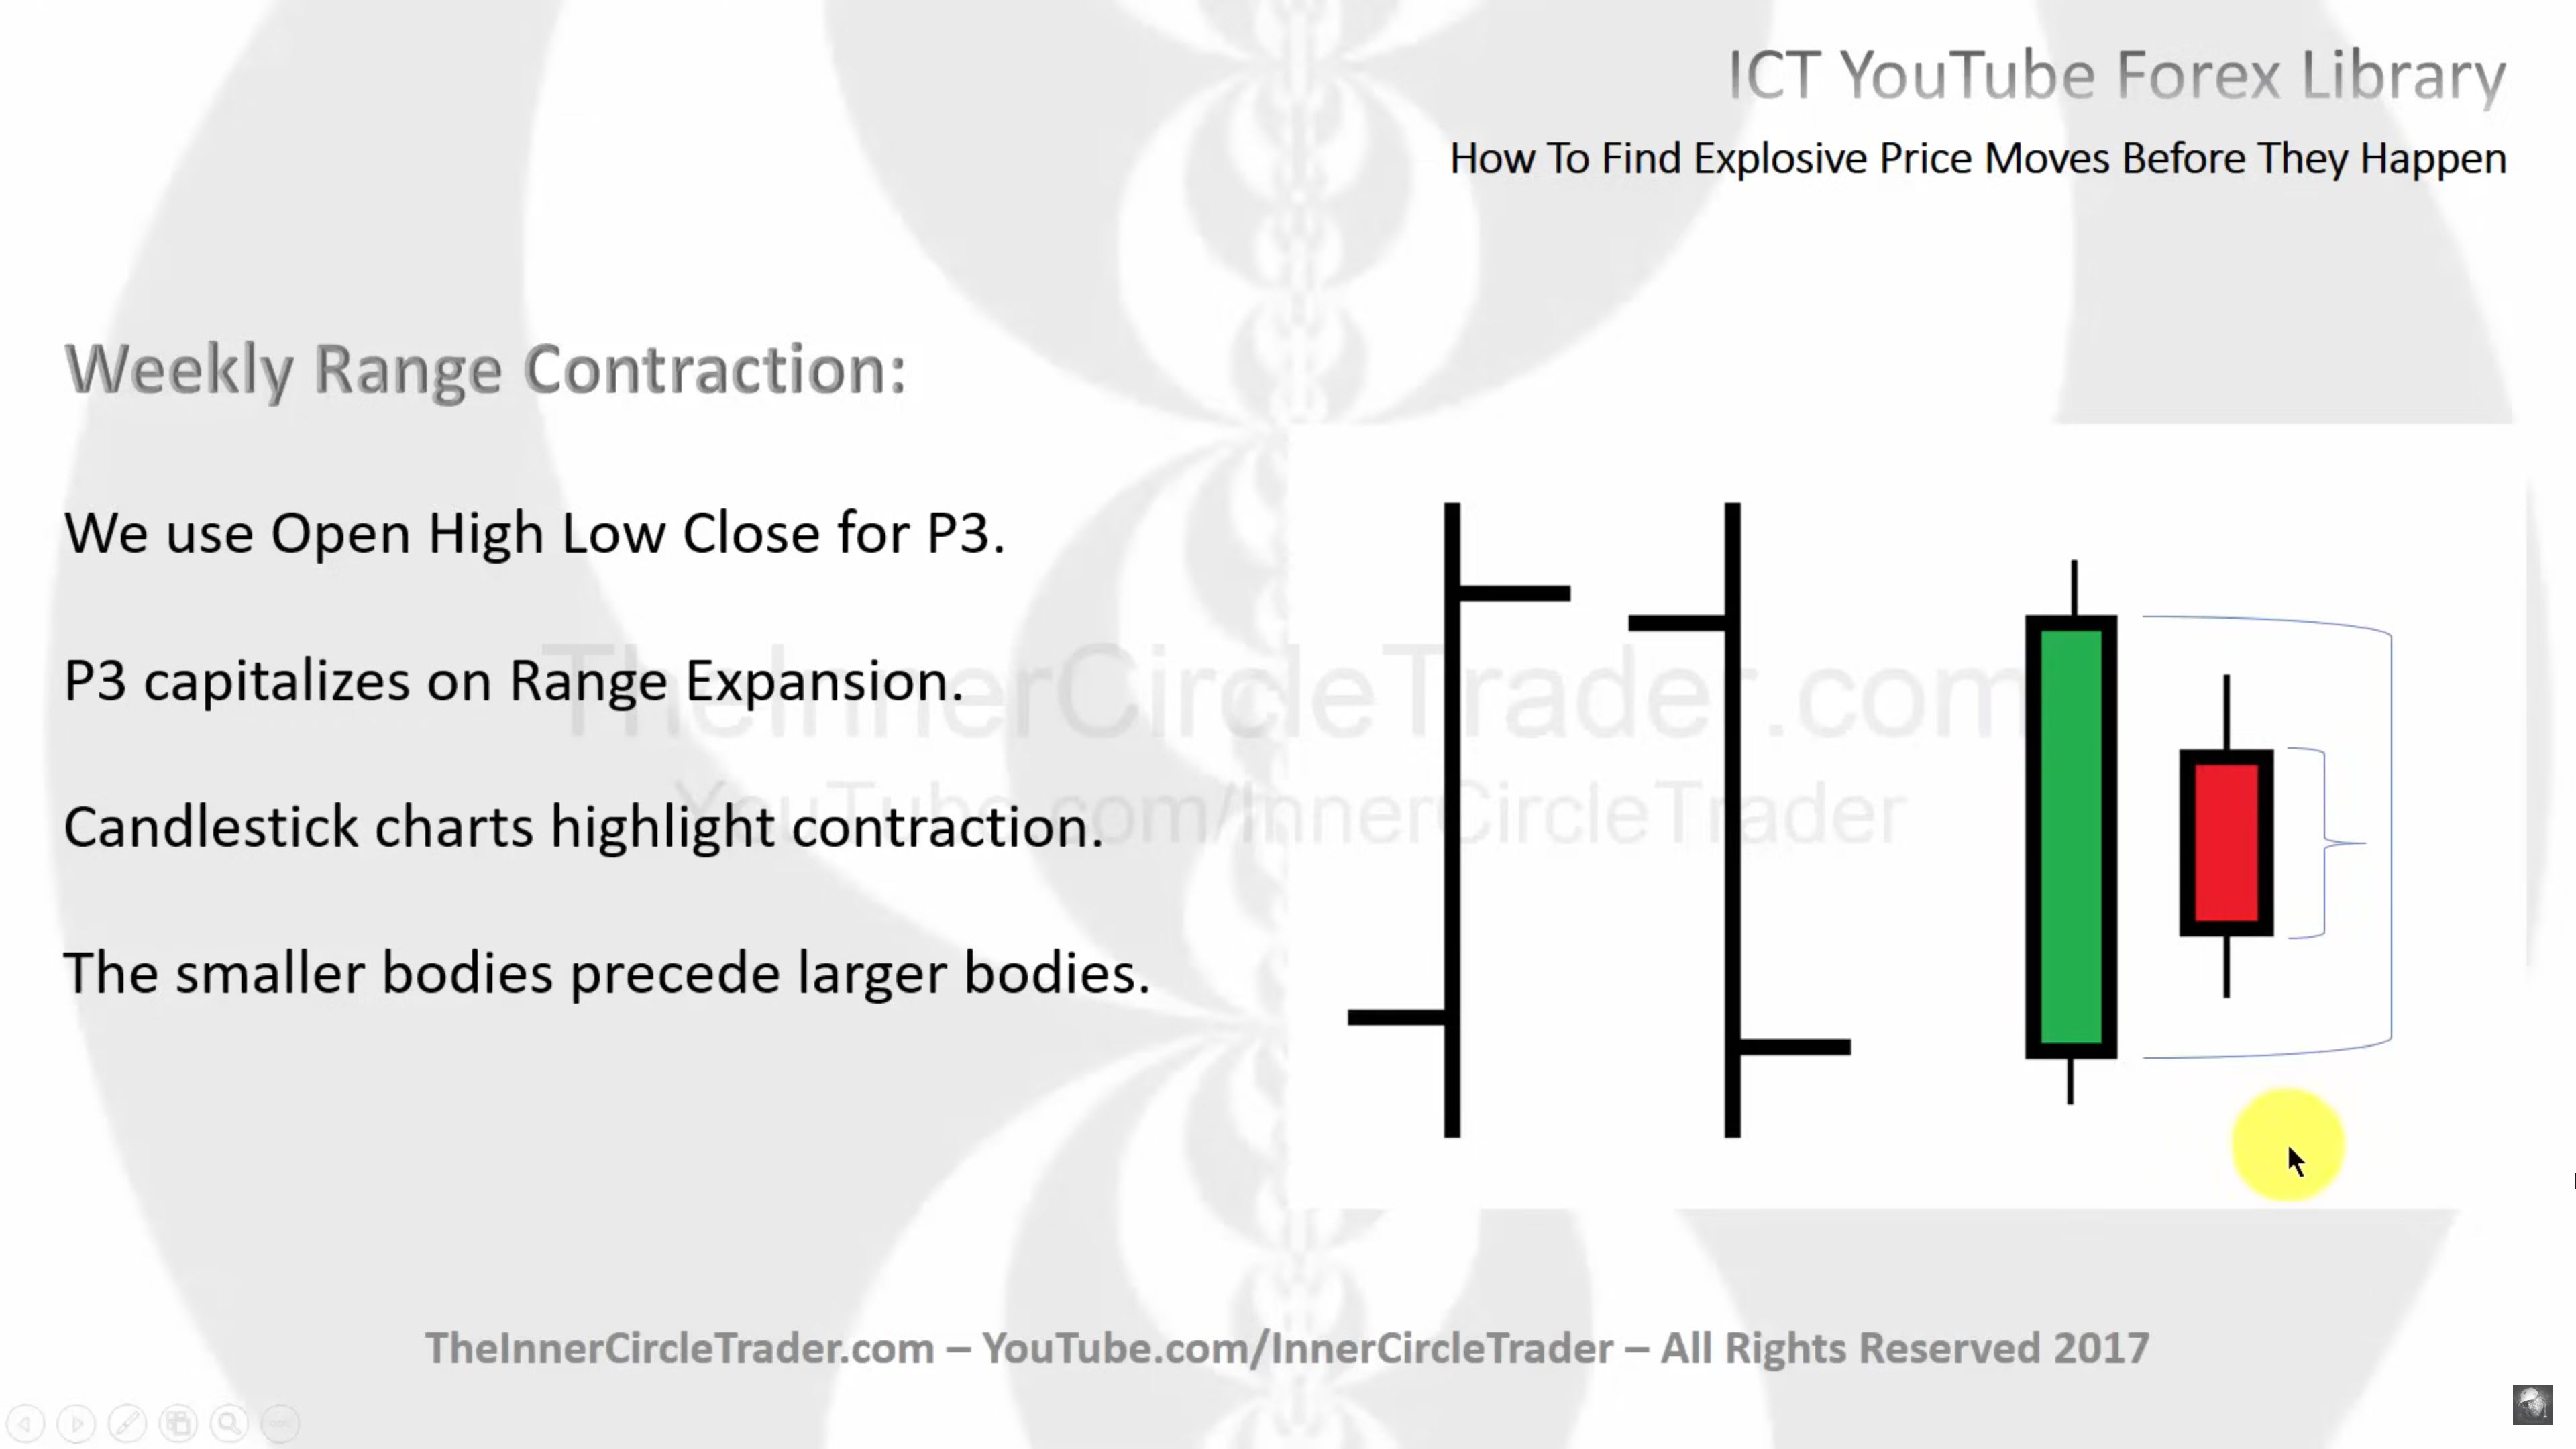
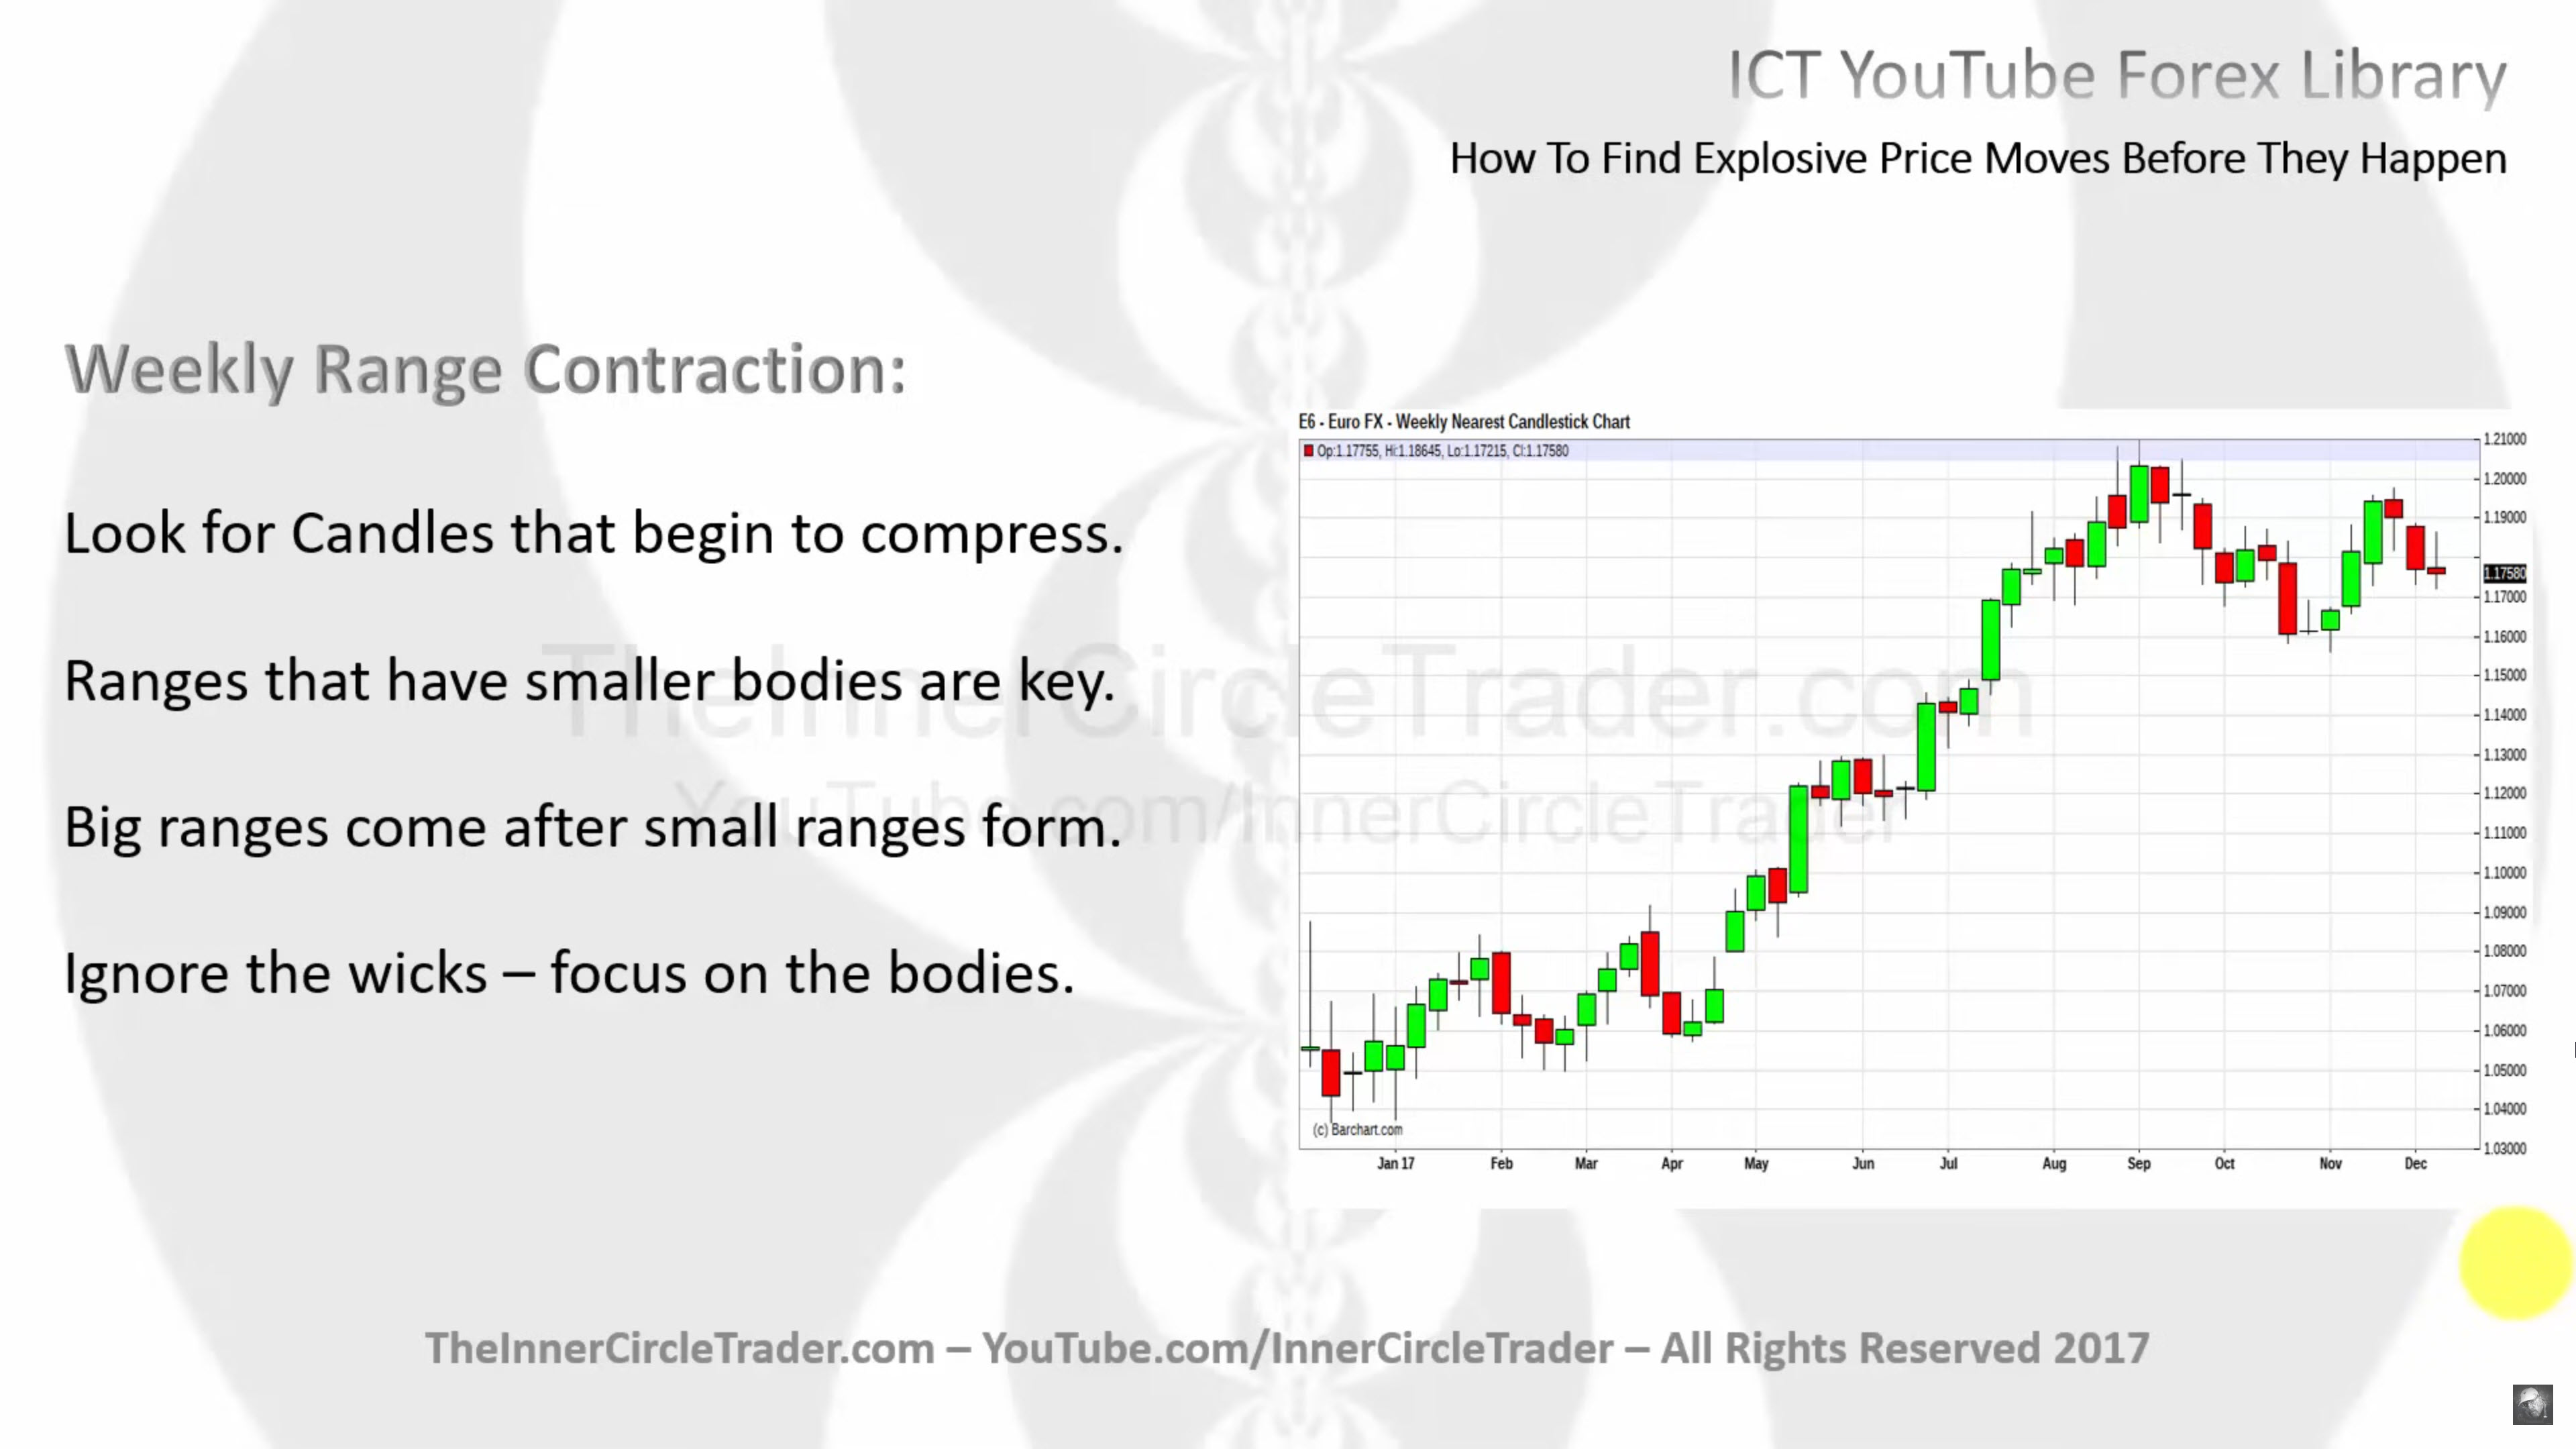
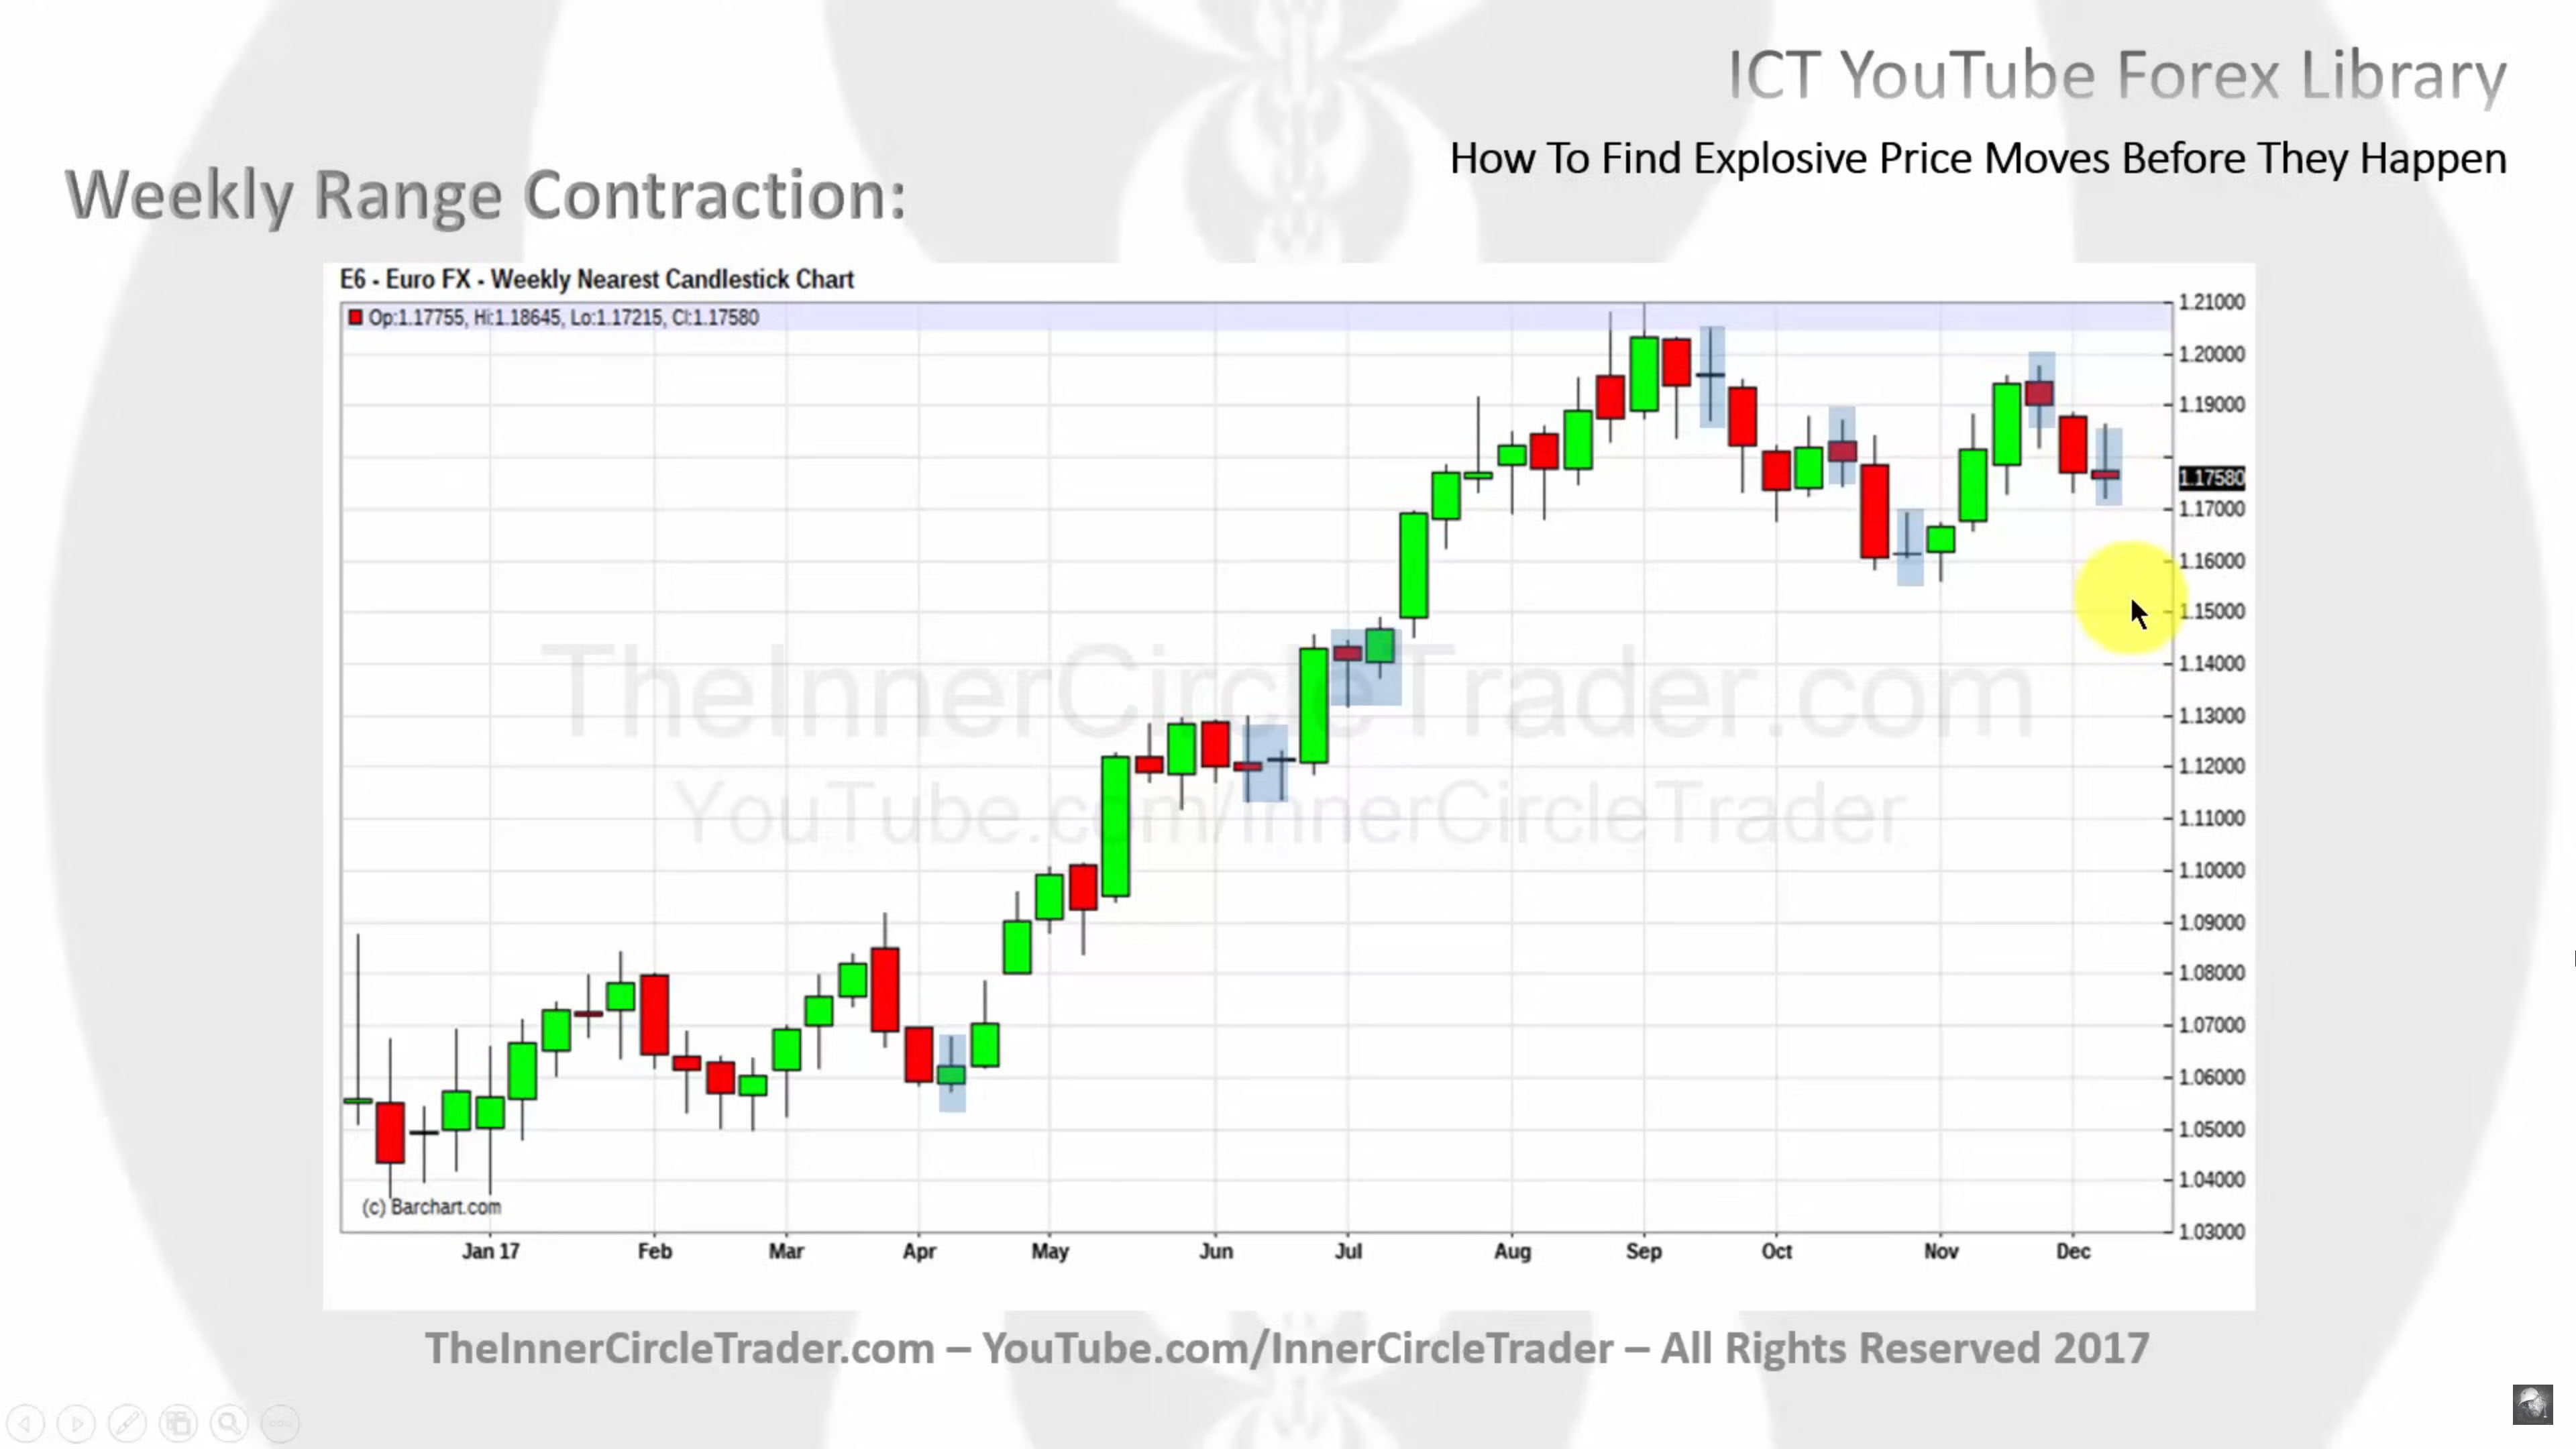
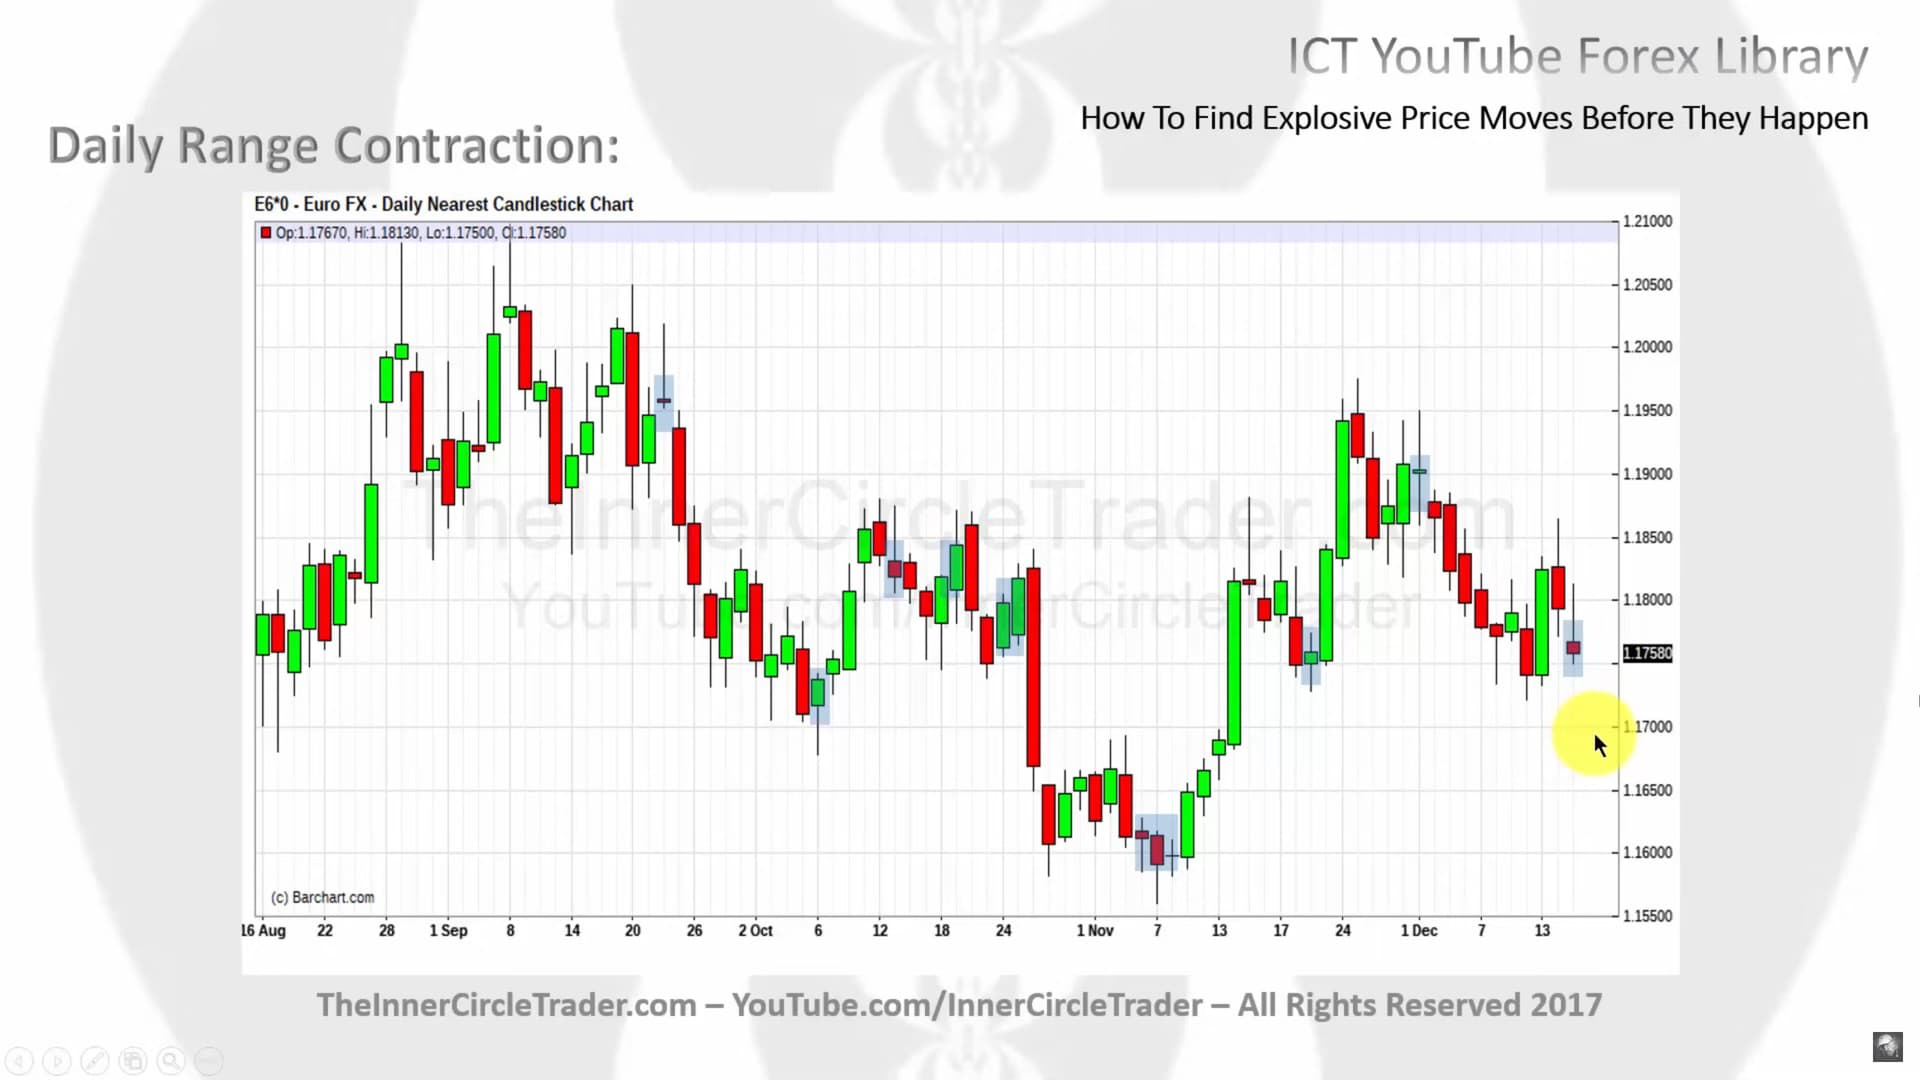
- Large range days often follow periods of range contraction (small candlestick bodies).
- We should focus on periods of market quietness, indicating potential large moves.
- Michael compares candle sizes based on their bodies, not by using wicks.
How To Find Explosive Price Moves Before They Happen - Commitment Of Traders
How To Find Explosive Price Moves Before They Happen - Commitment Of Traders Example
How To Find Explosive Price Moves Before They Happen - Weekly Range Contraction
How To Find Explosive Price Moves Before They Happen - Weekly Range Contraction 2
How To Find Explosive Price Moves Before They Happen - Weekly Range Contraction Examples
How To Find Explosive Price Moves Before They Happen - Daily Range Contraction Examples
Next lesson: ICT Forex - Market Maker Primer Course - Higher Time Frame Concepts
Previous lesson: ICT Forex - Market Maker Primer Course - COT Insights For Effective Price Action Analysis