Notes
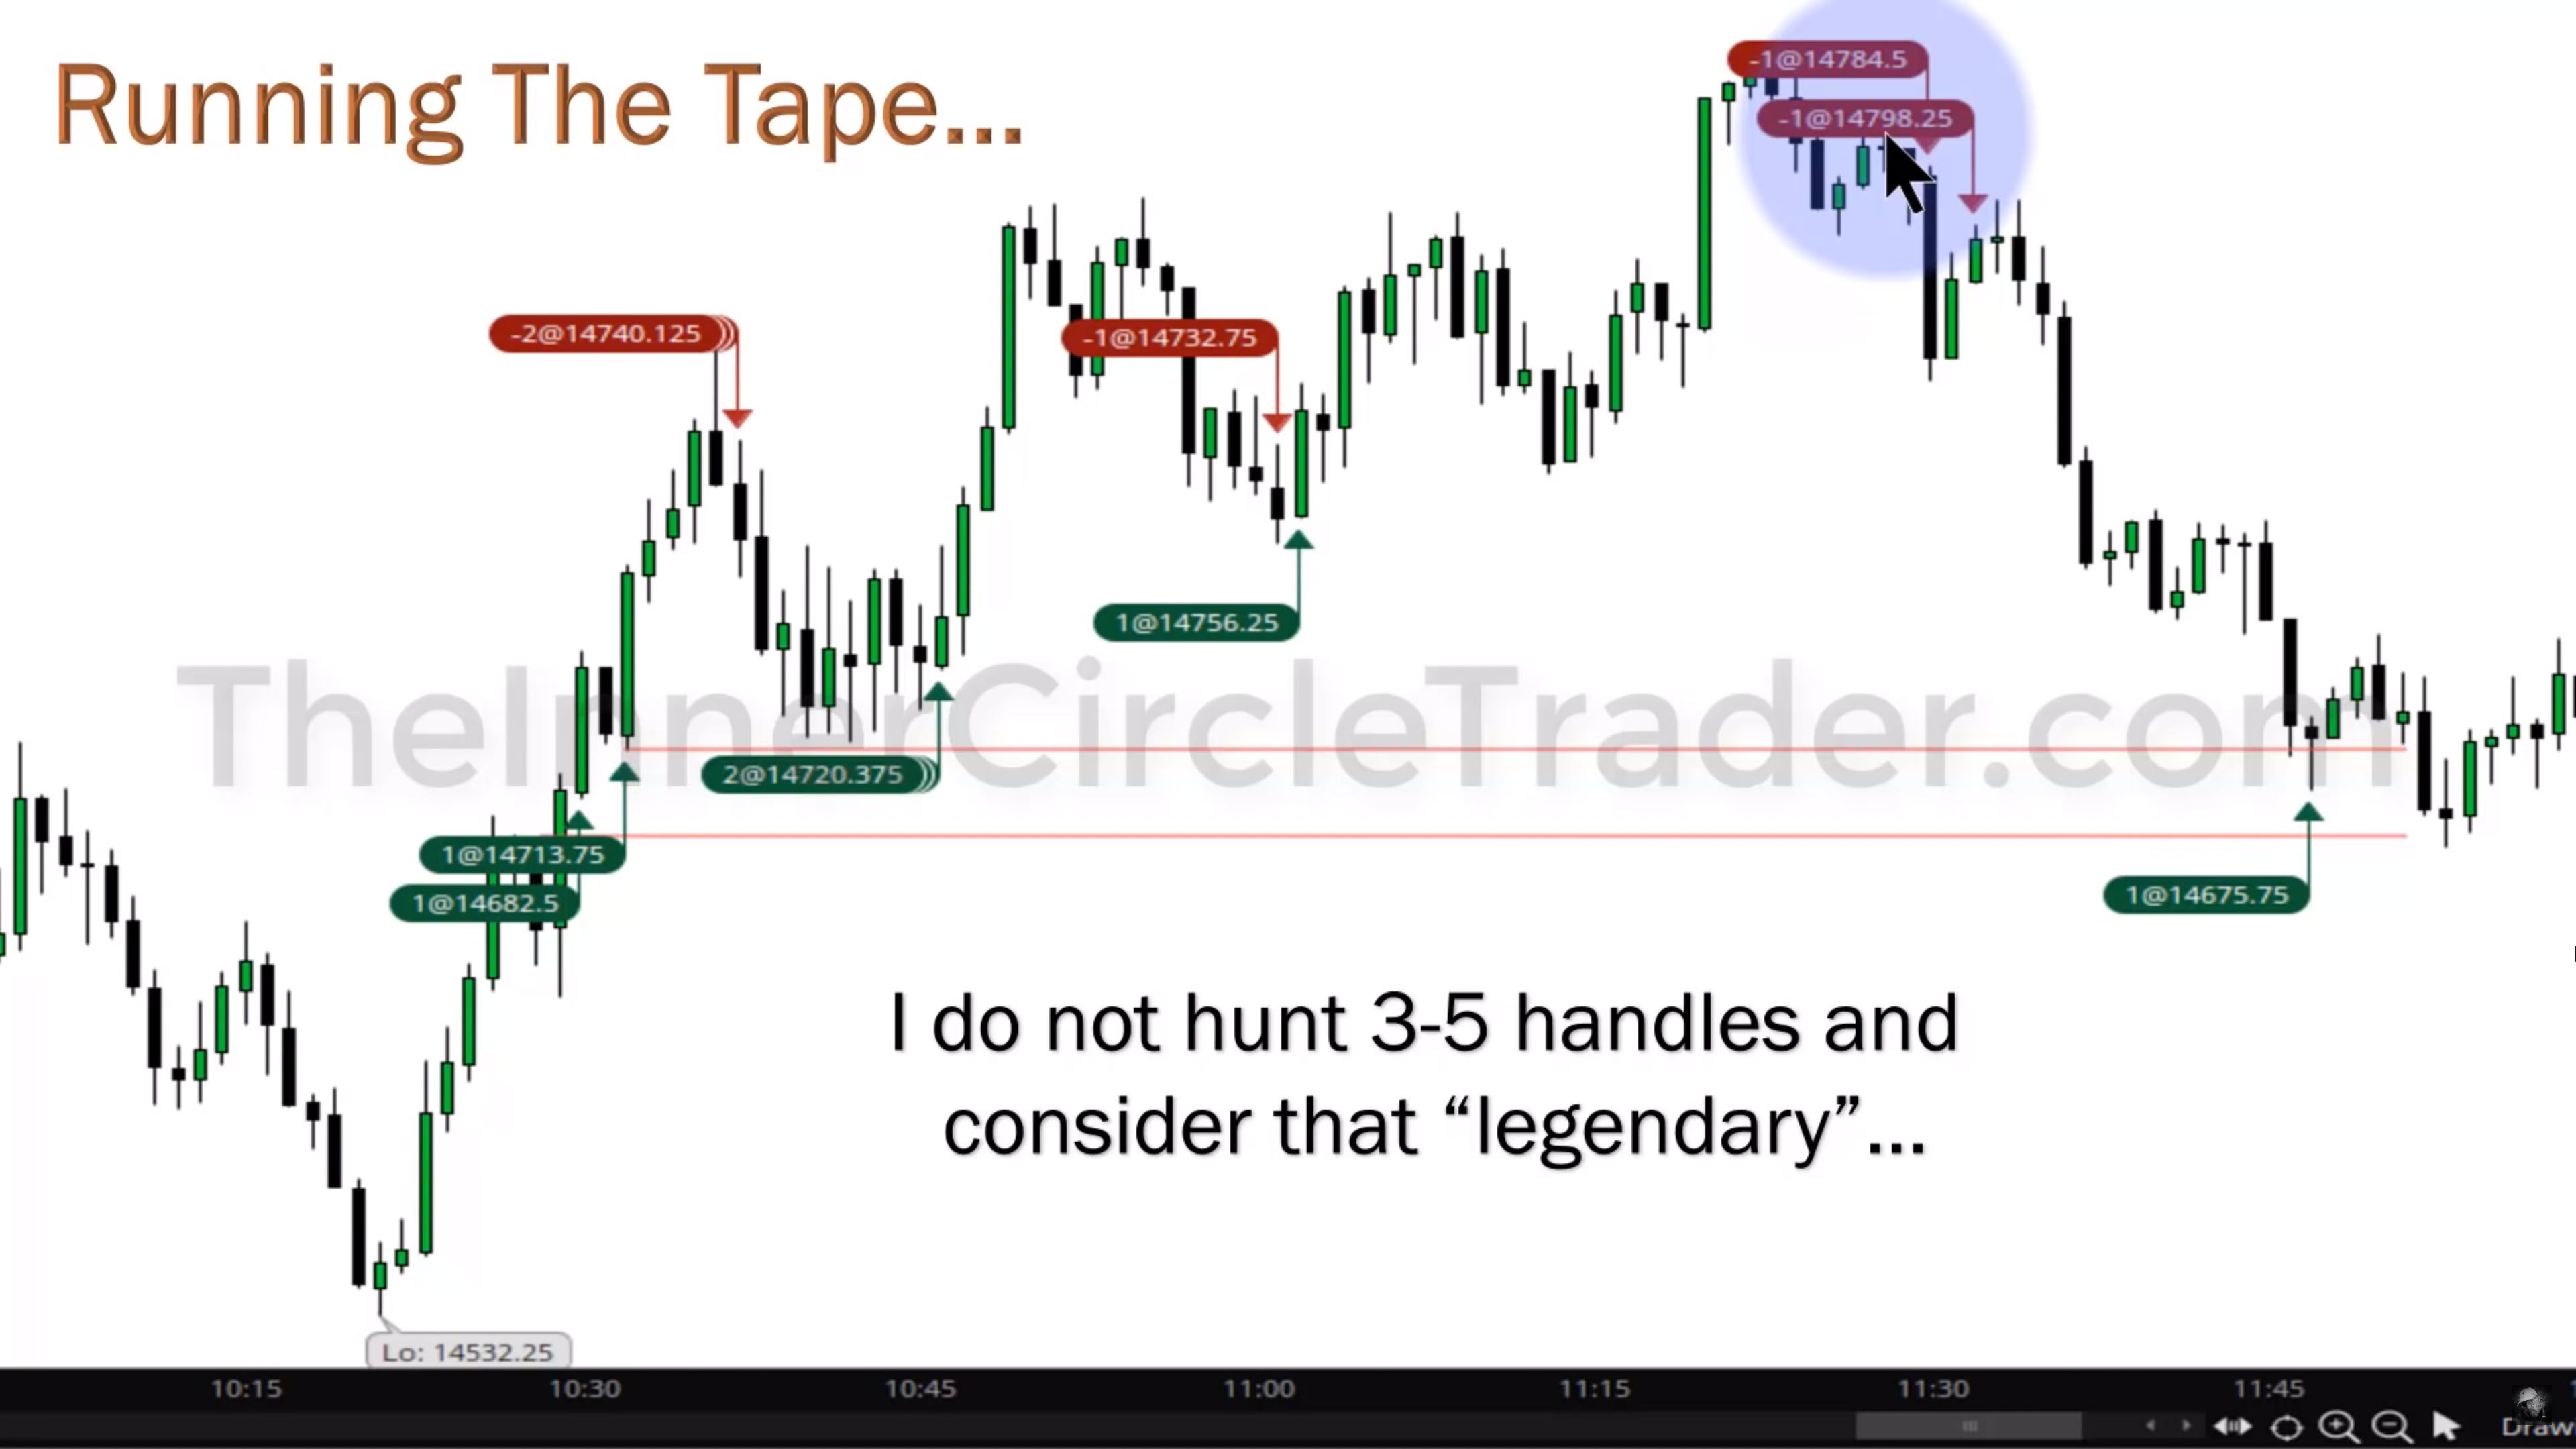
- 1 handle = 4 ticks (1 point).
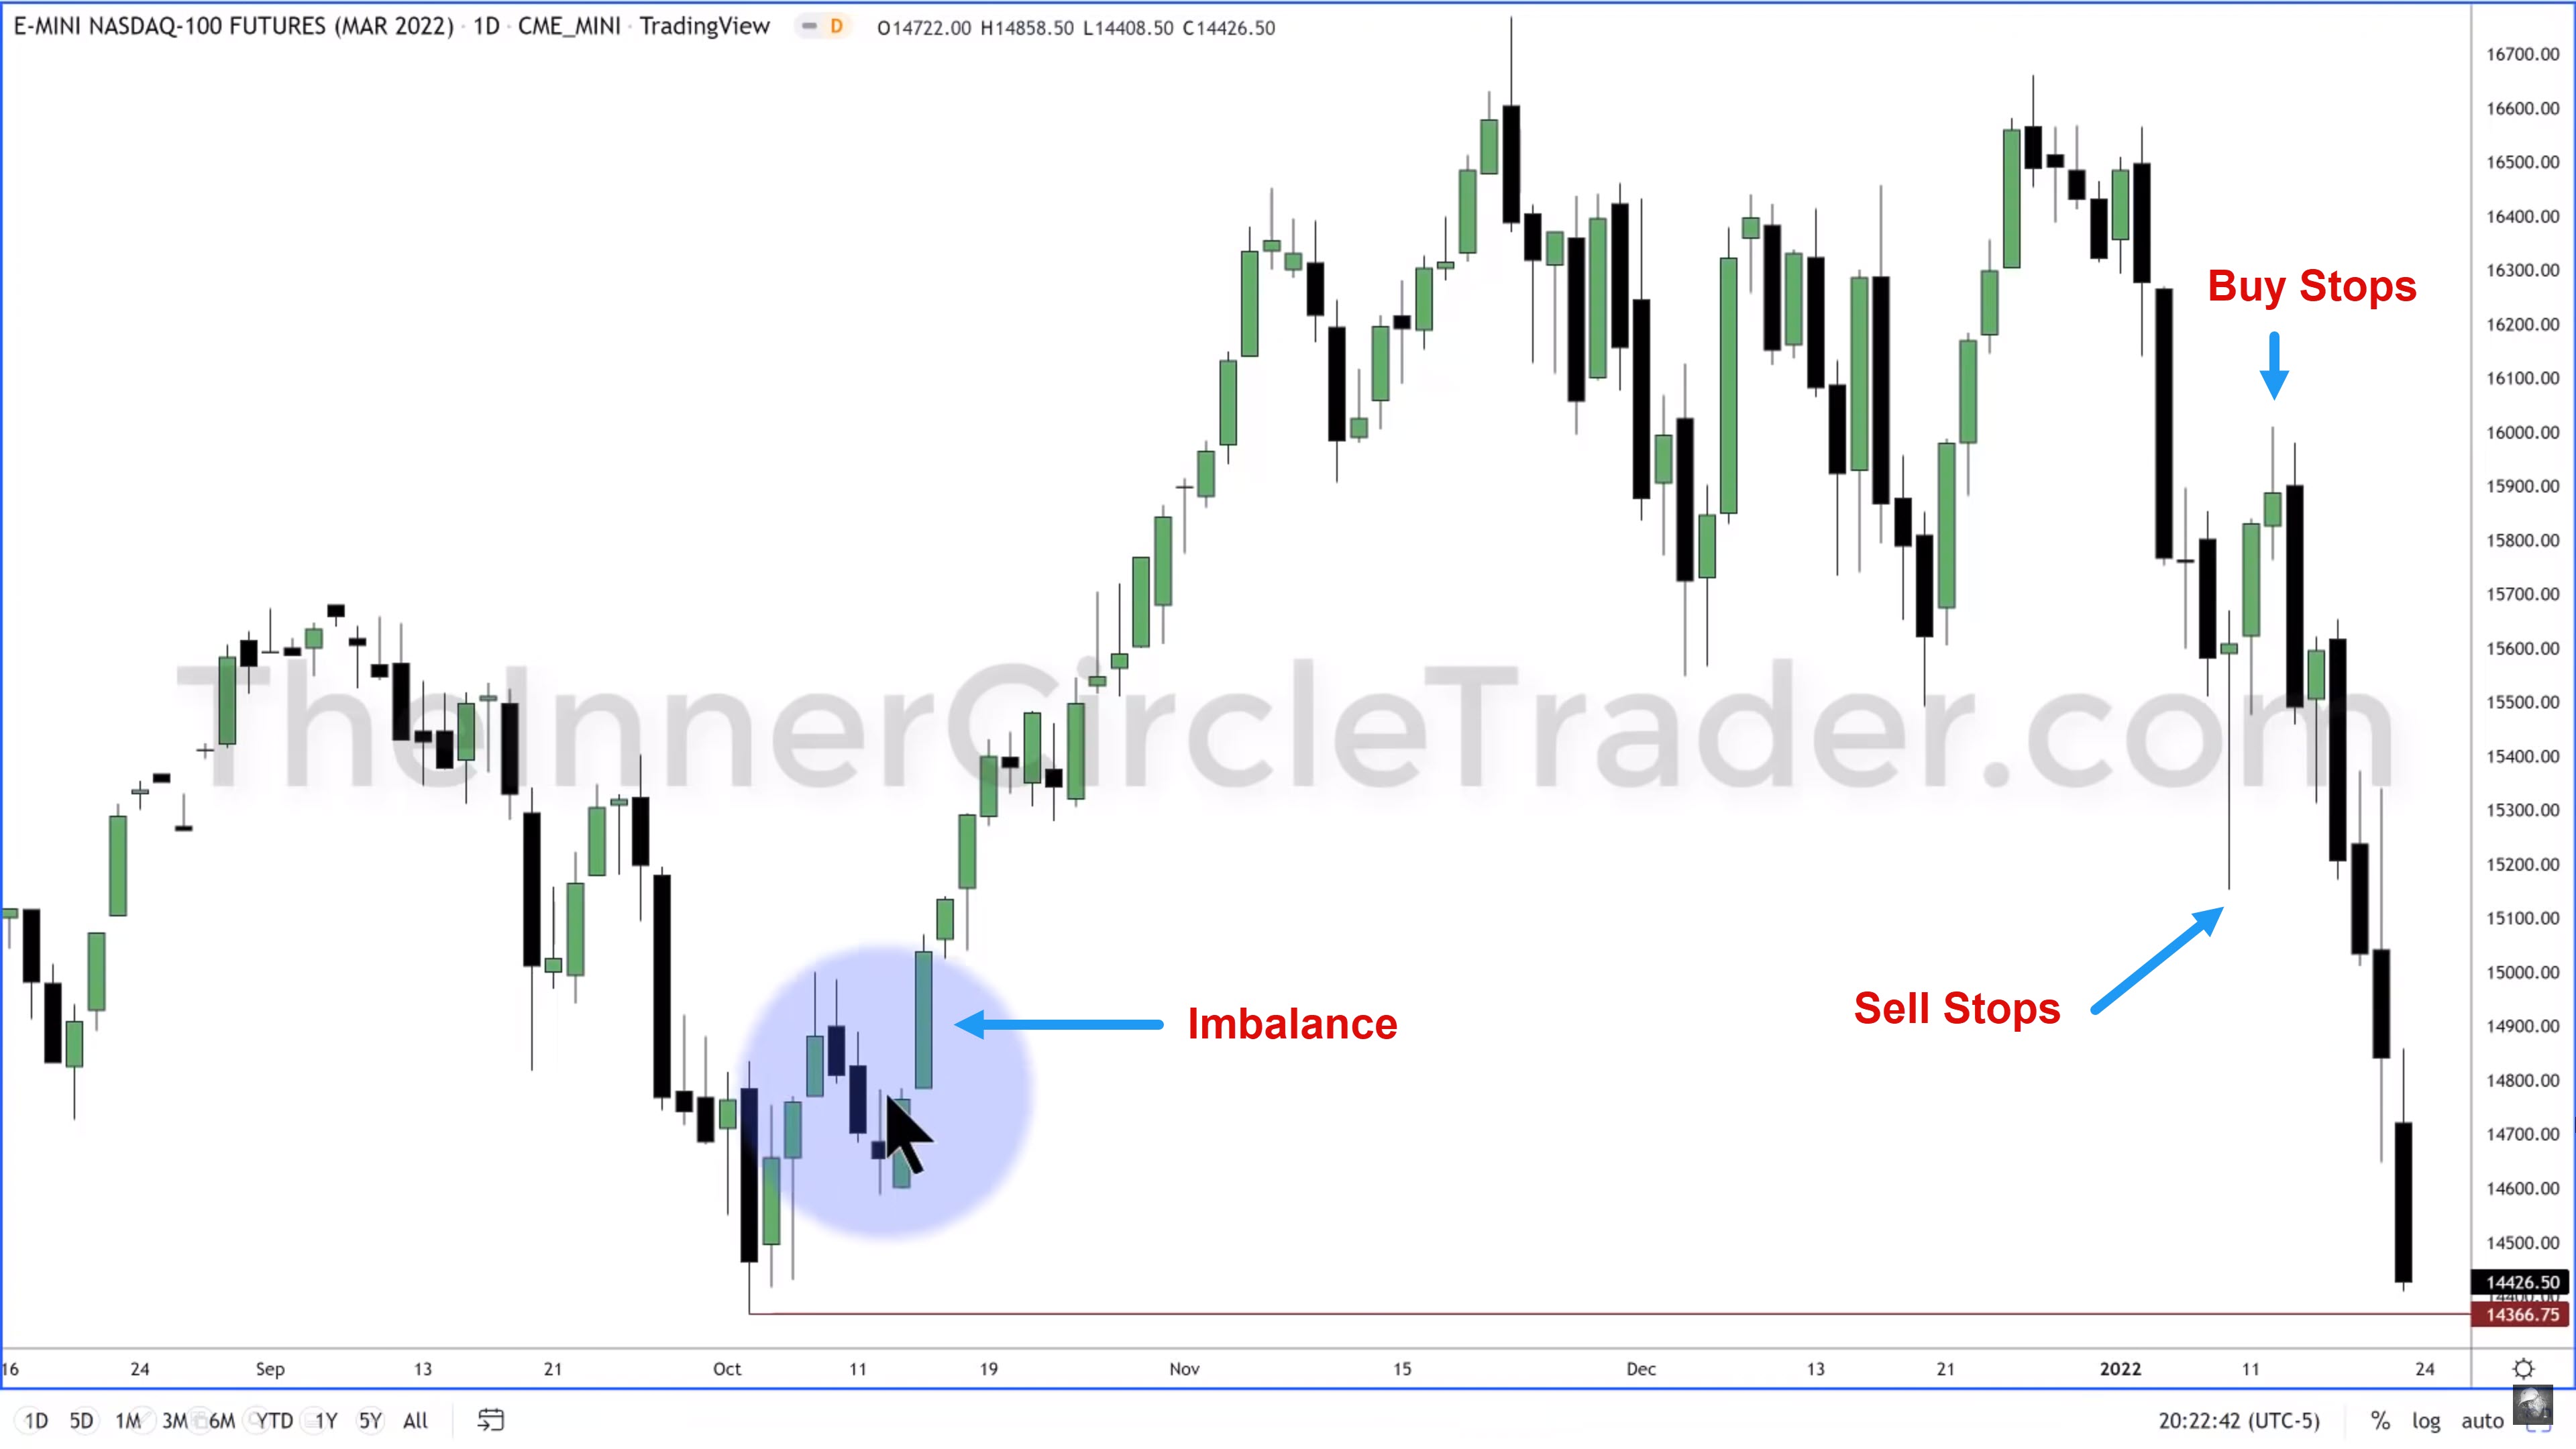
- Price always goes after stop losses or wants to fill imbalances, such as liquidity voids and fair value gaps.
- A stop hunt precedes every significant movement.
- If we expect a significant move down, the price will likely make a run on buy stops first (buy-side liquidity).
- If we expect a significant move up, the price will likely make a run on sell stops first (sell-side liquidity).
- According to Michael, high-frequency algorithms do not operate on higher time frames than the 3-minute chart. However, they mostly use multi-second charts.
- To find imbalances in the indices, Michael recommends using 1-minute, 2-minute, 3-minute, and 5-minute charts. We should always view them simultaneously.
- If we want to open a short position, we enter at a premium and exit at a discount.
- If we want to open a long position, we enter at a discount and exit at a premium.
- Homework:
- Go through your Emini Futures Intraday charts. Look for Breaks in Market Structure and then look for an Imbalance in Price.
- Determine where an opposite High or Low resides then log & backtest the number of handles you see in hindsight examples.
[Elements To A Trade Setup - Trade Examples in Thinkorswim Platform
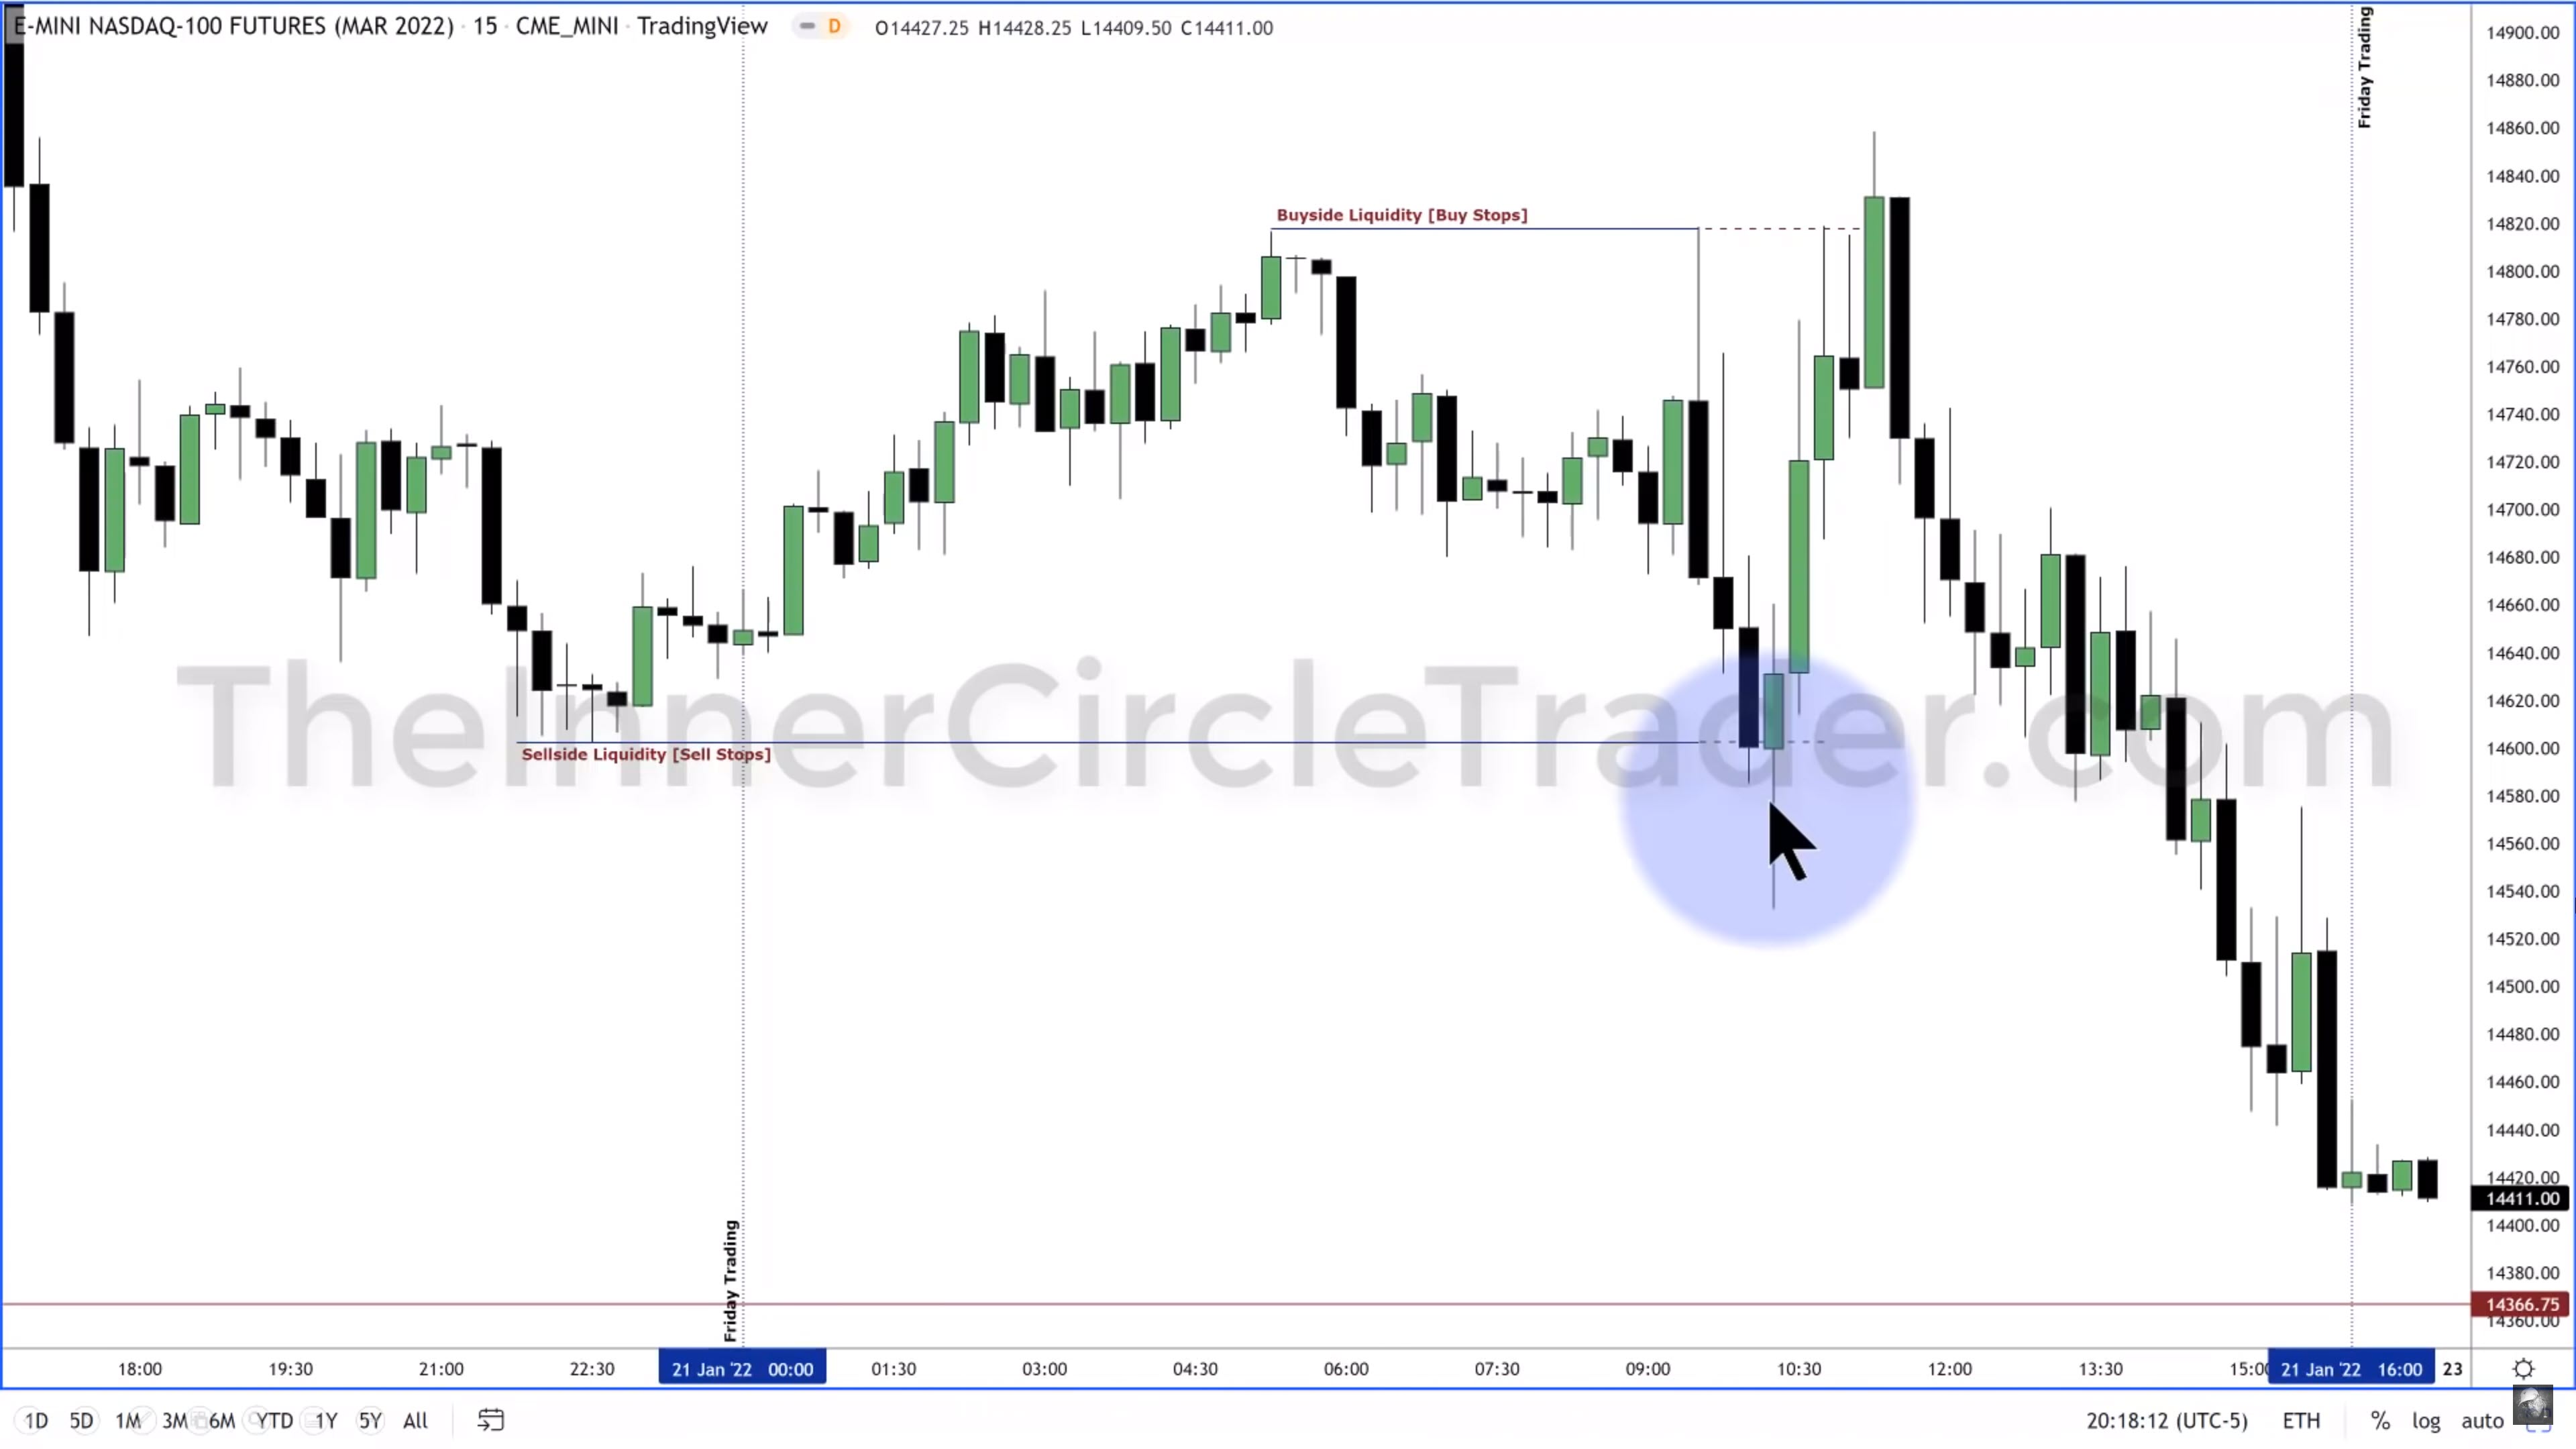
Elements To A Trade Setup - Buy Stops, Sell Stops, And Imbalance
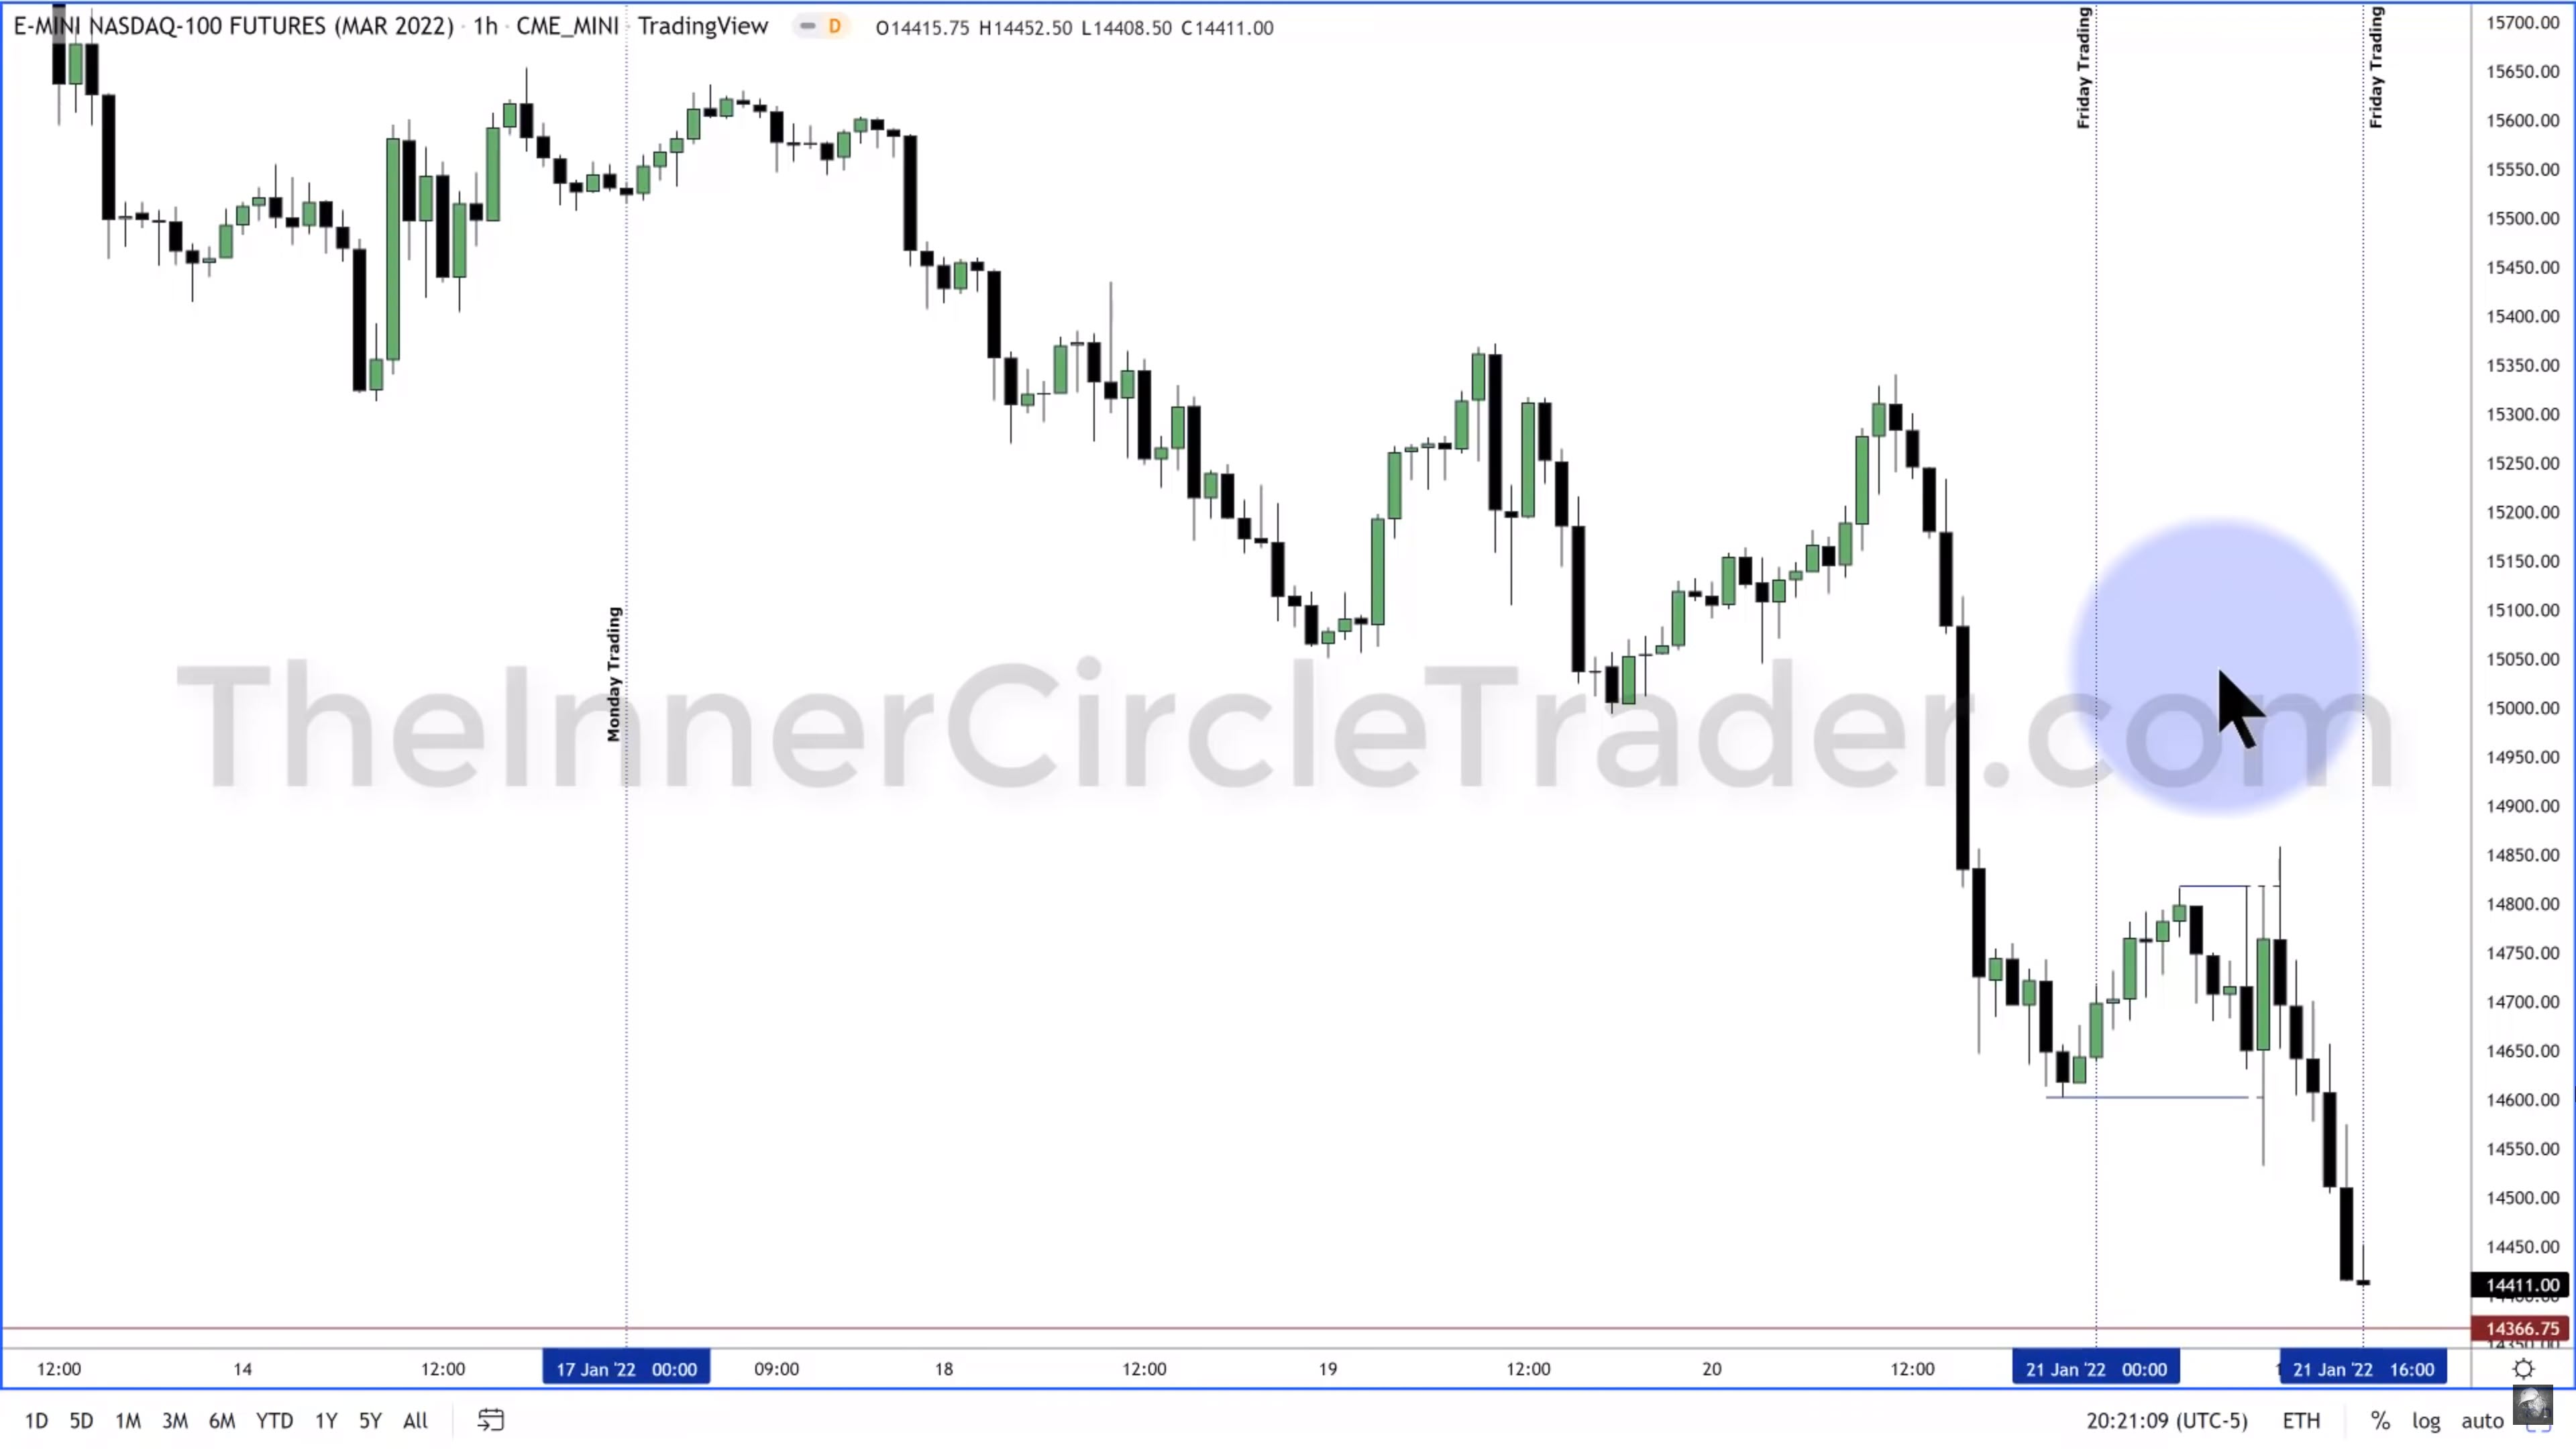
Elements To A Trade Setup - Nasdaq 100 Hourly Chart
Elements To A Trade Setup - Nasdaq 100 15-Minute Chart
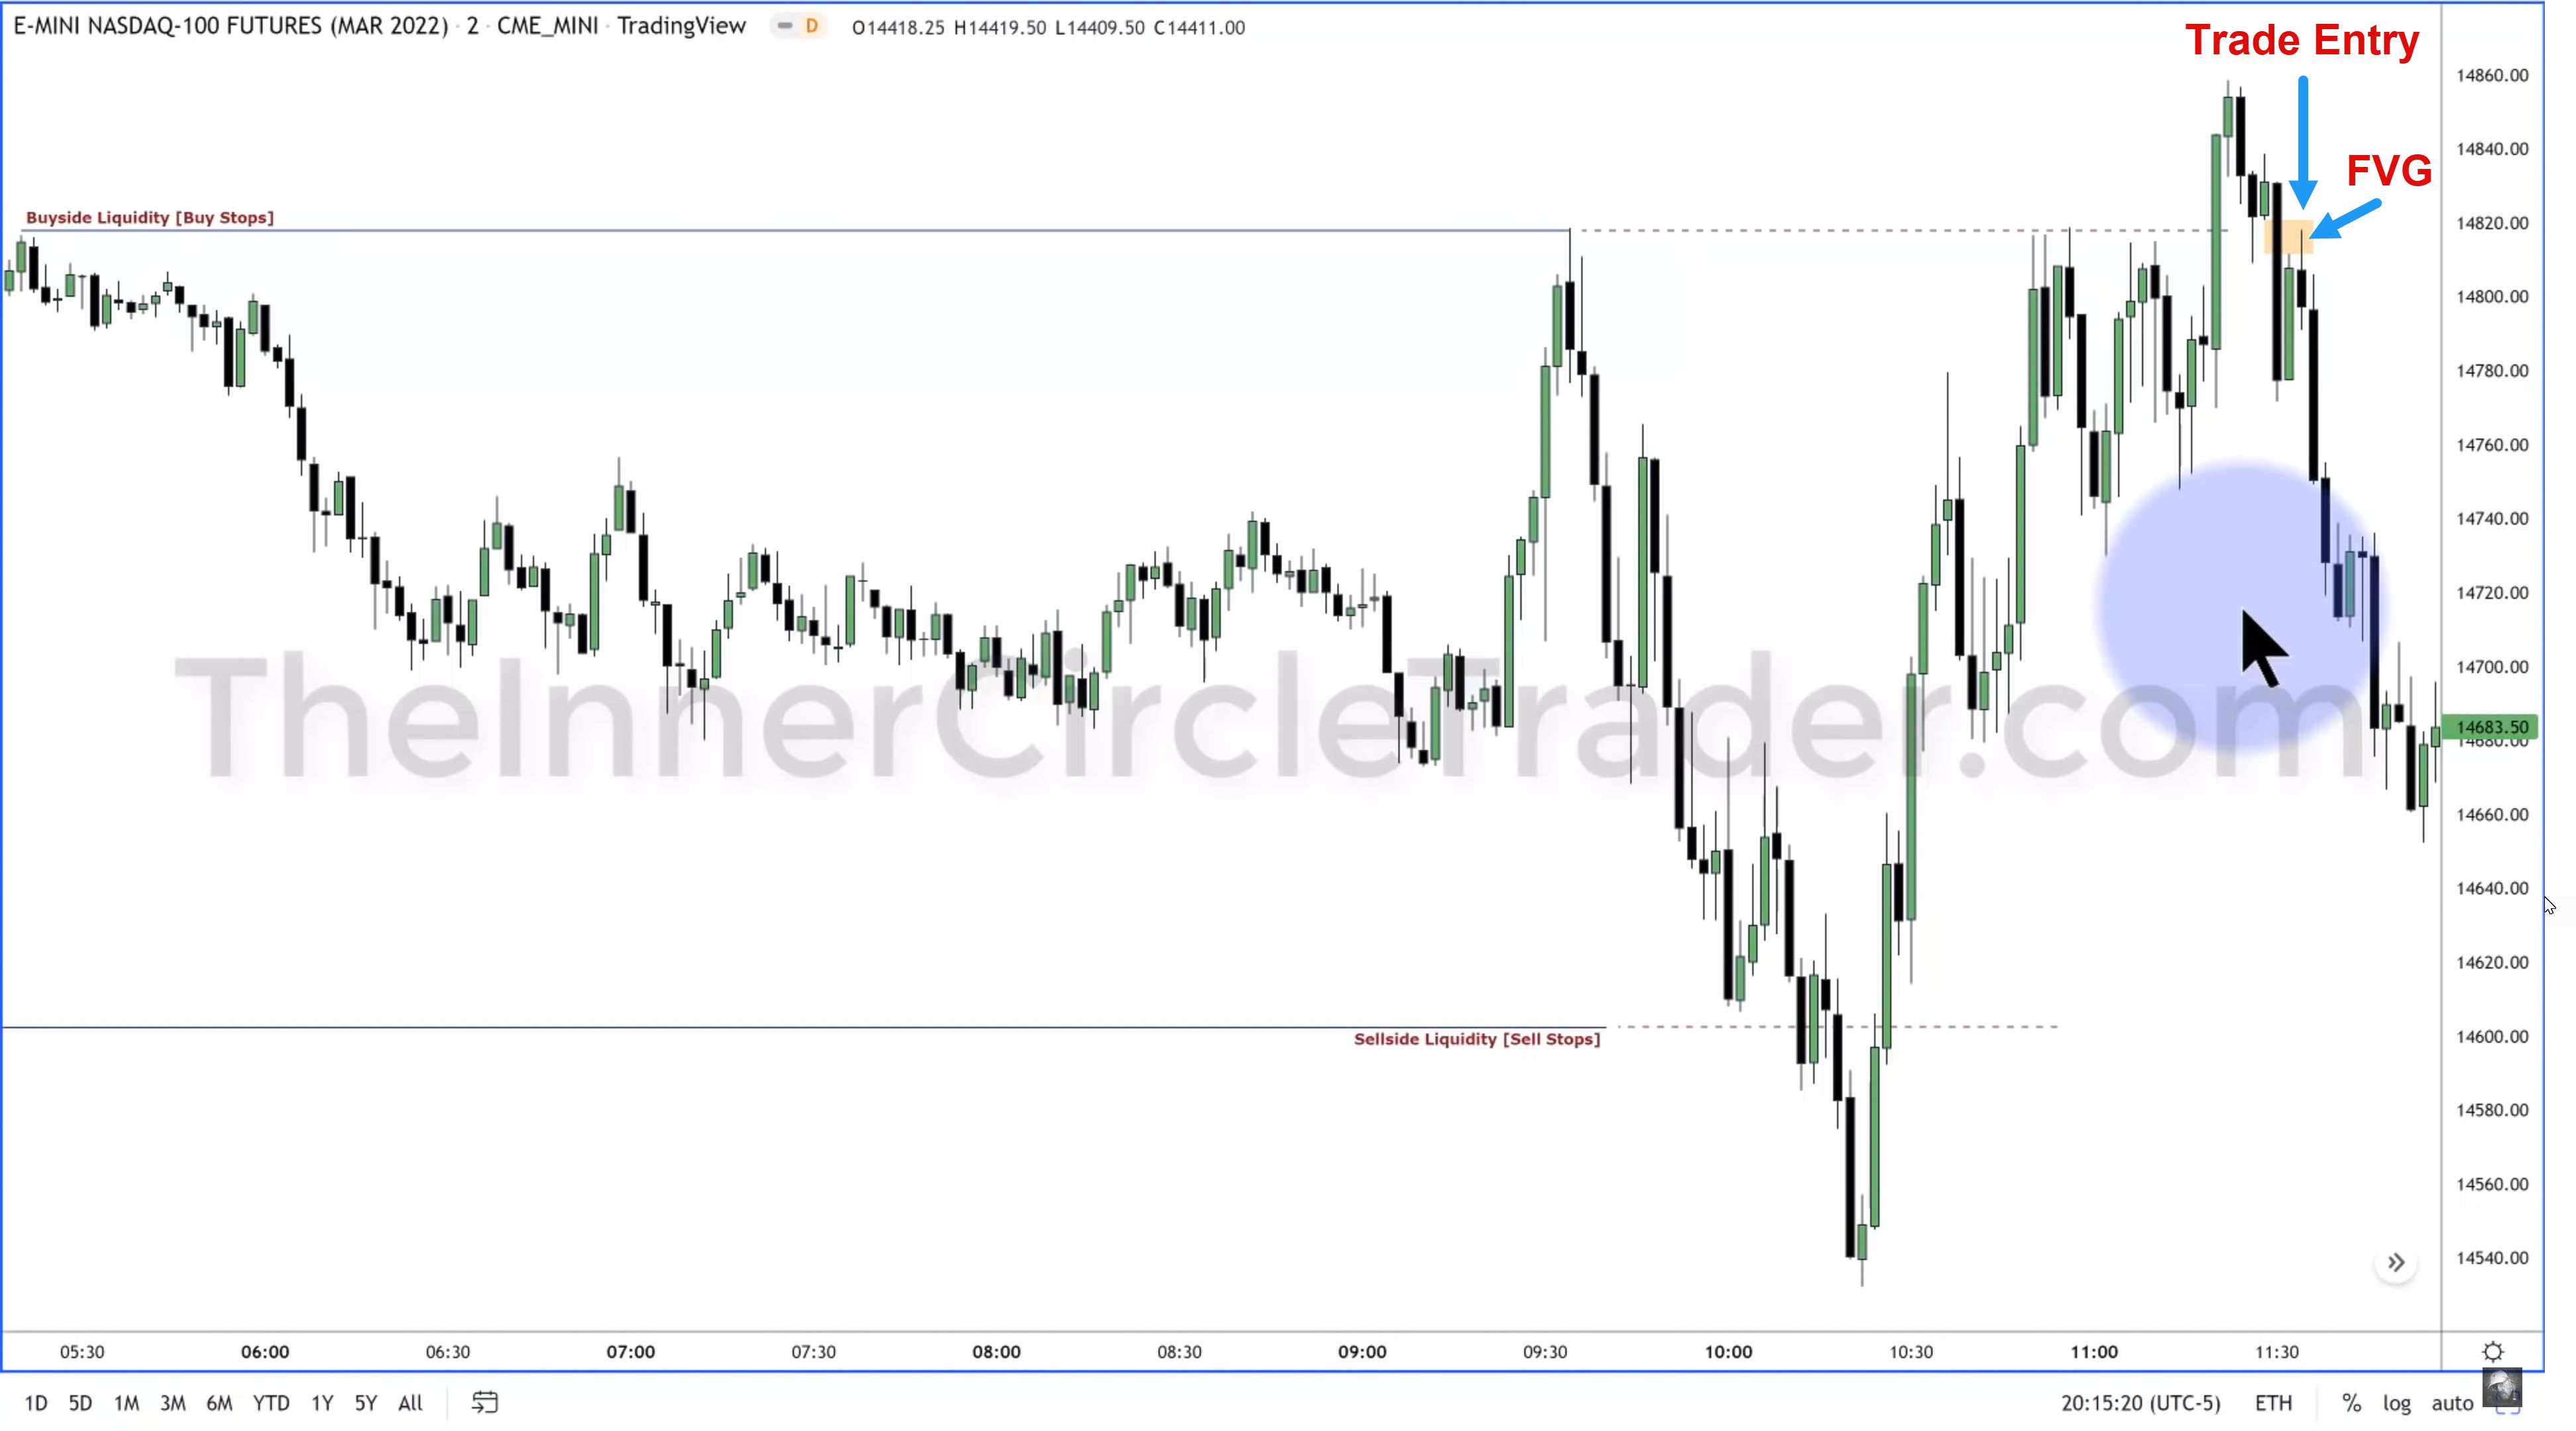
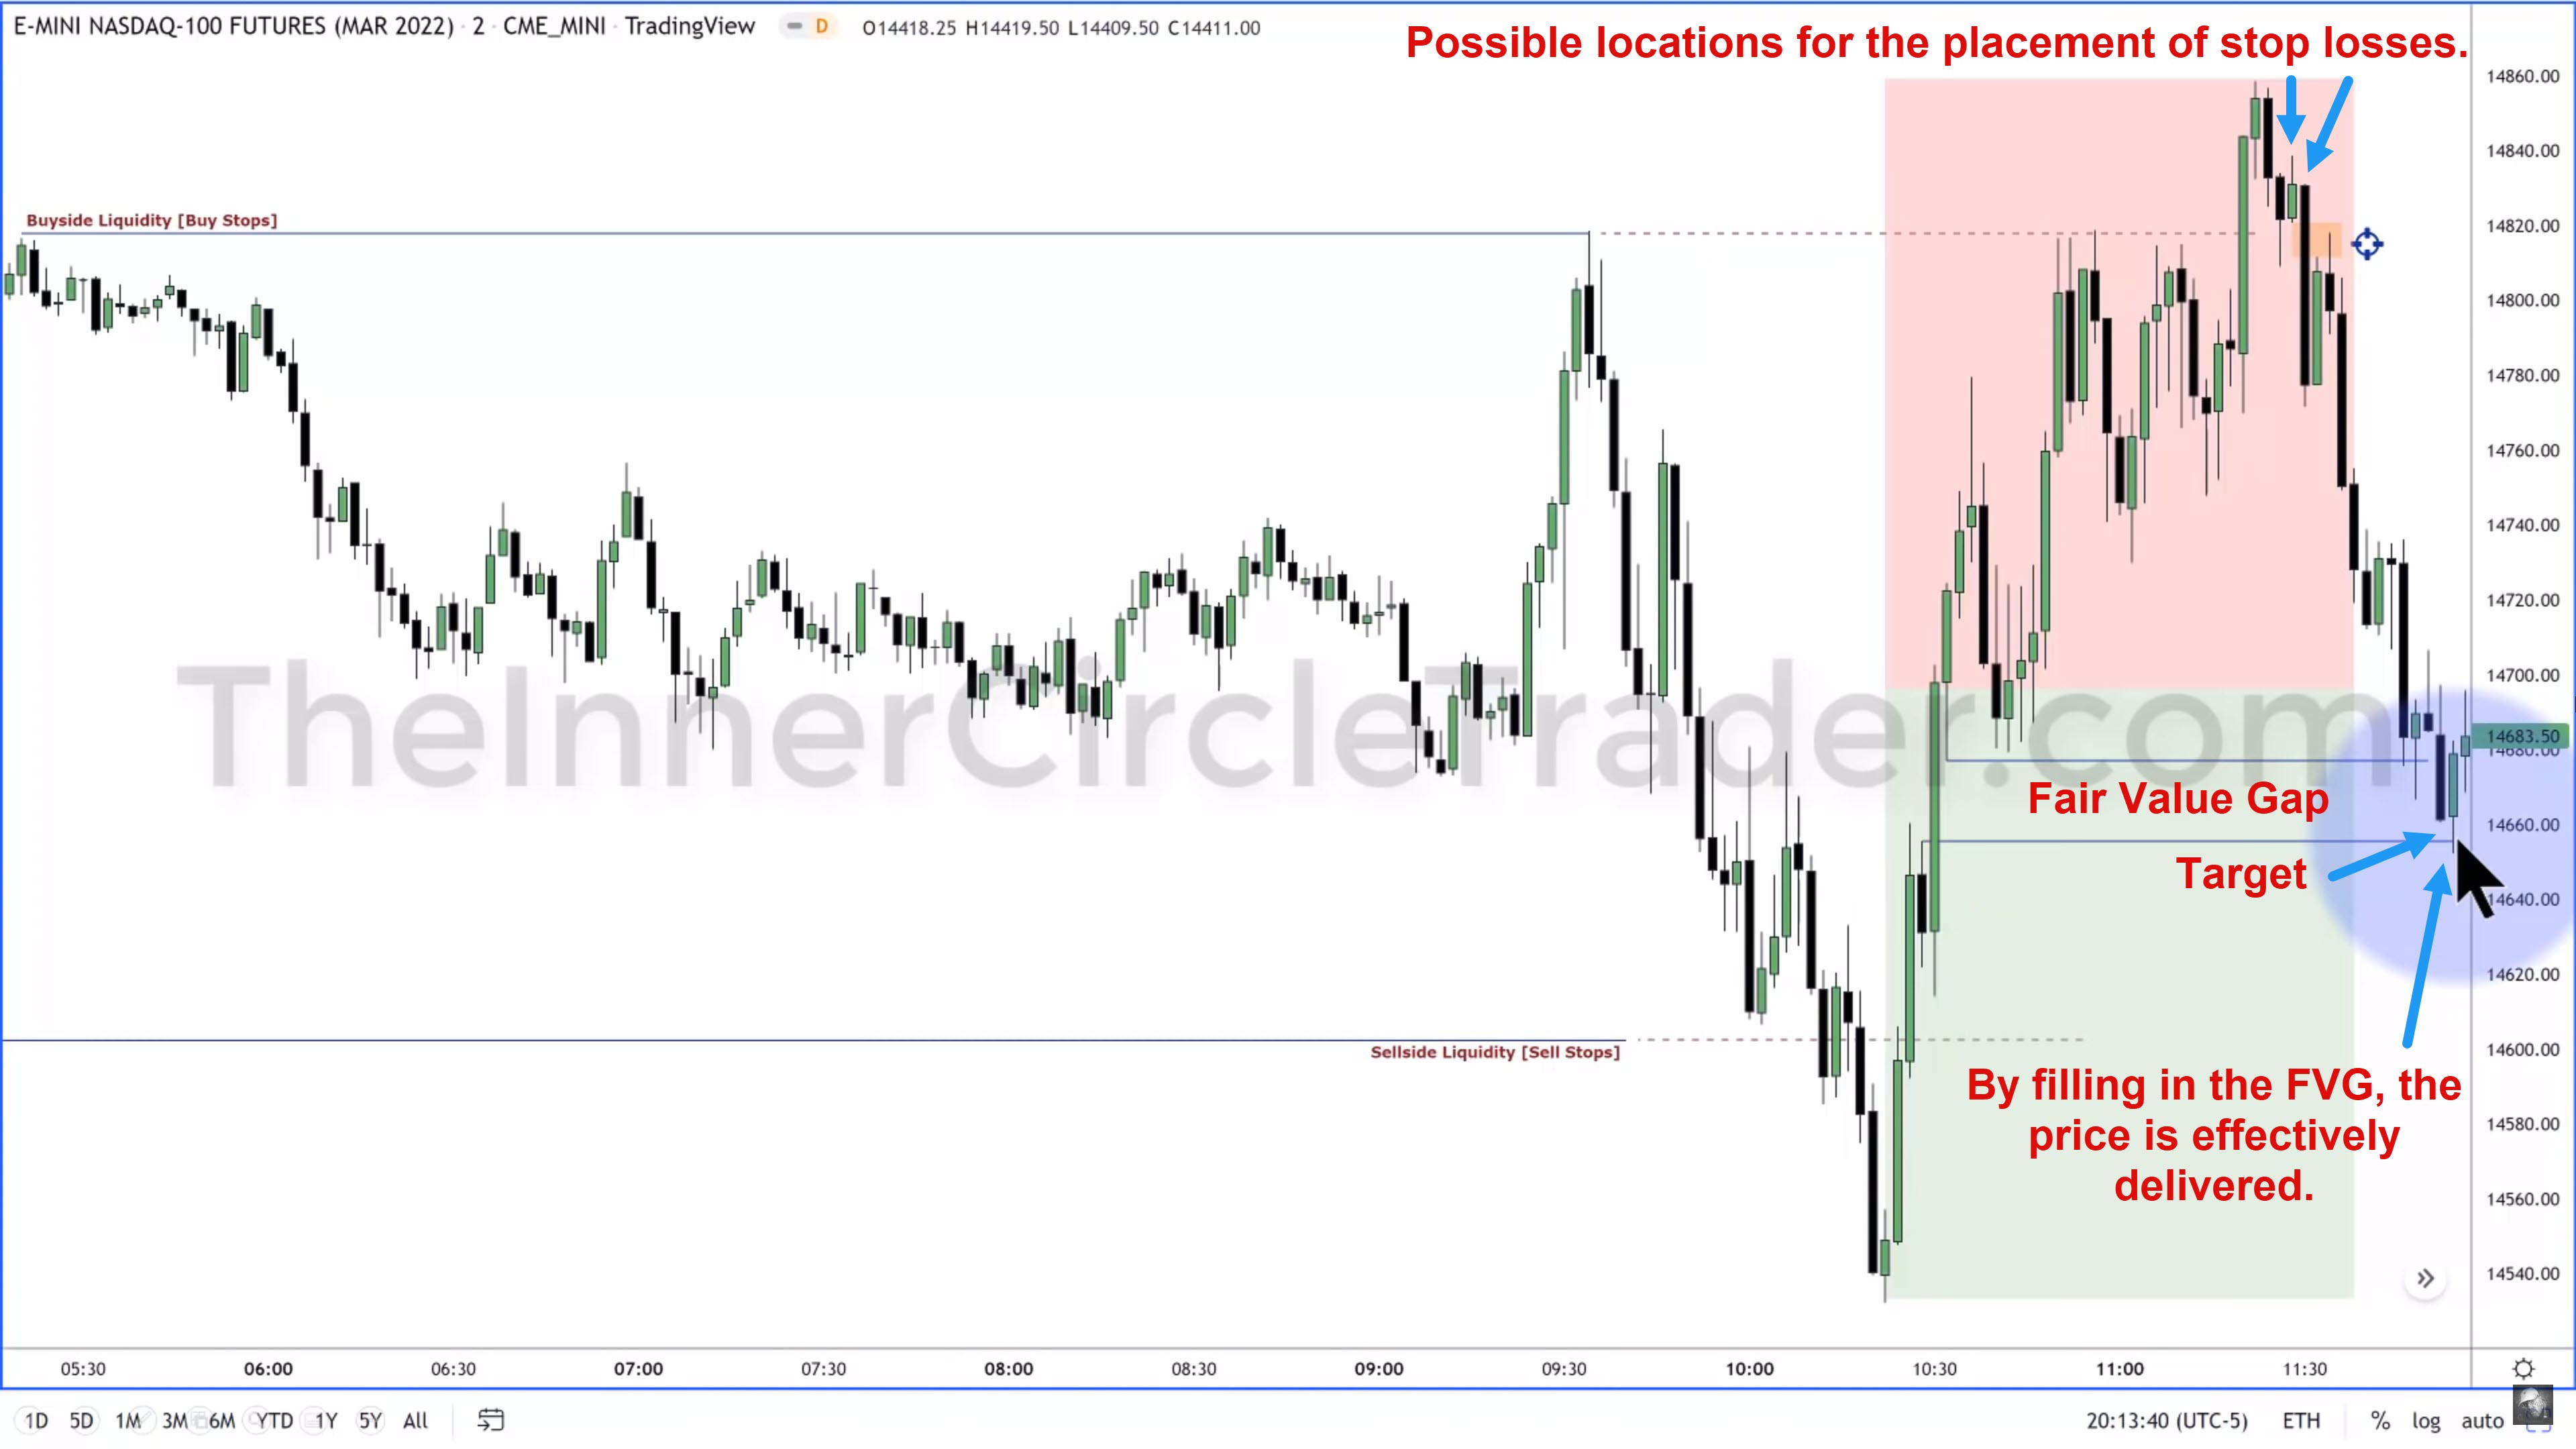
Elements To A Trade Setup - ICT YouTube 2022 Model Trade Entry Example
Elements To A Trade Setup - Premium And Discount
Next lesson: 2022 ICT Mentorship - Episode 3 - Internal Range Liquidity & Market Structure Shifts
Previous lesson: 2022 ICT Mentorship - Episode 1 - Introduction