
Notes
- The algorithm uses time-based charts.
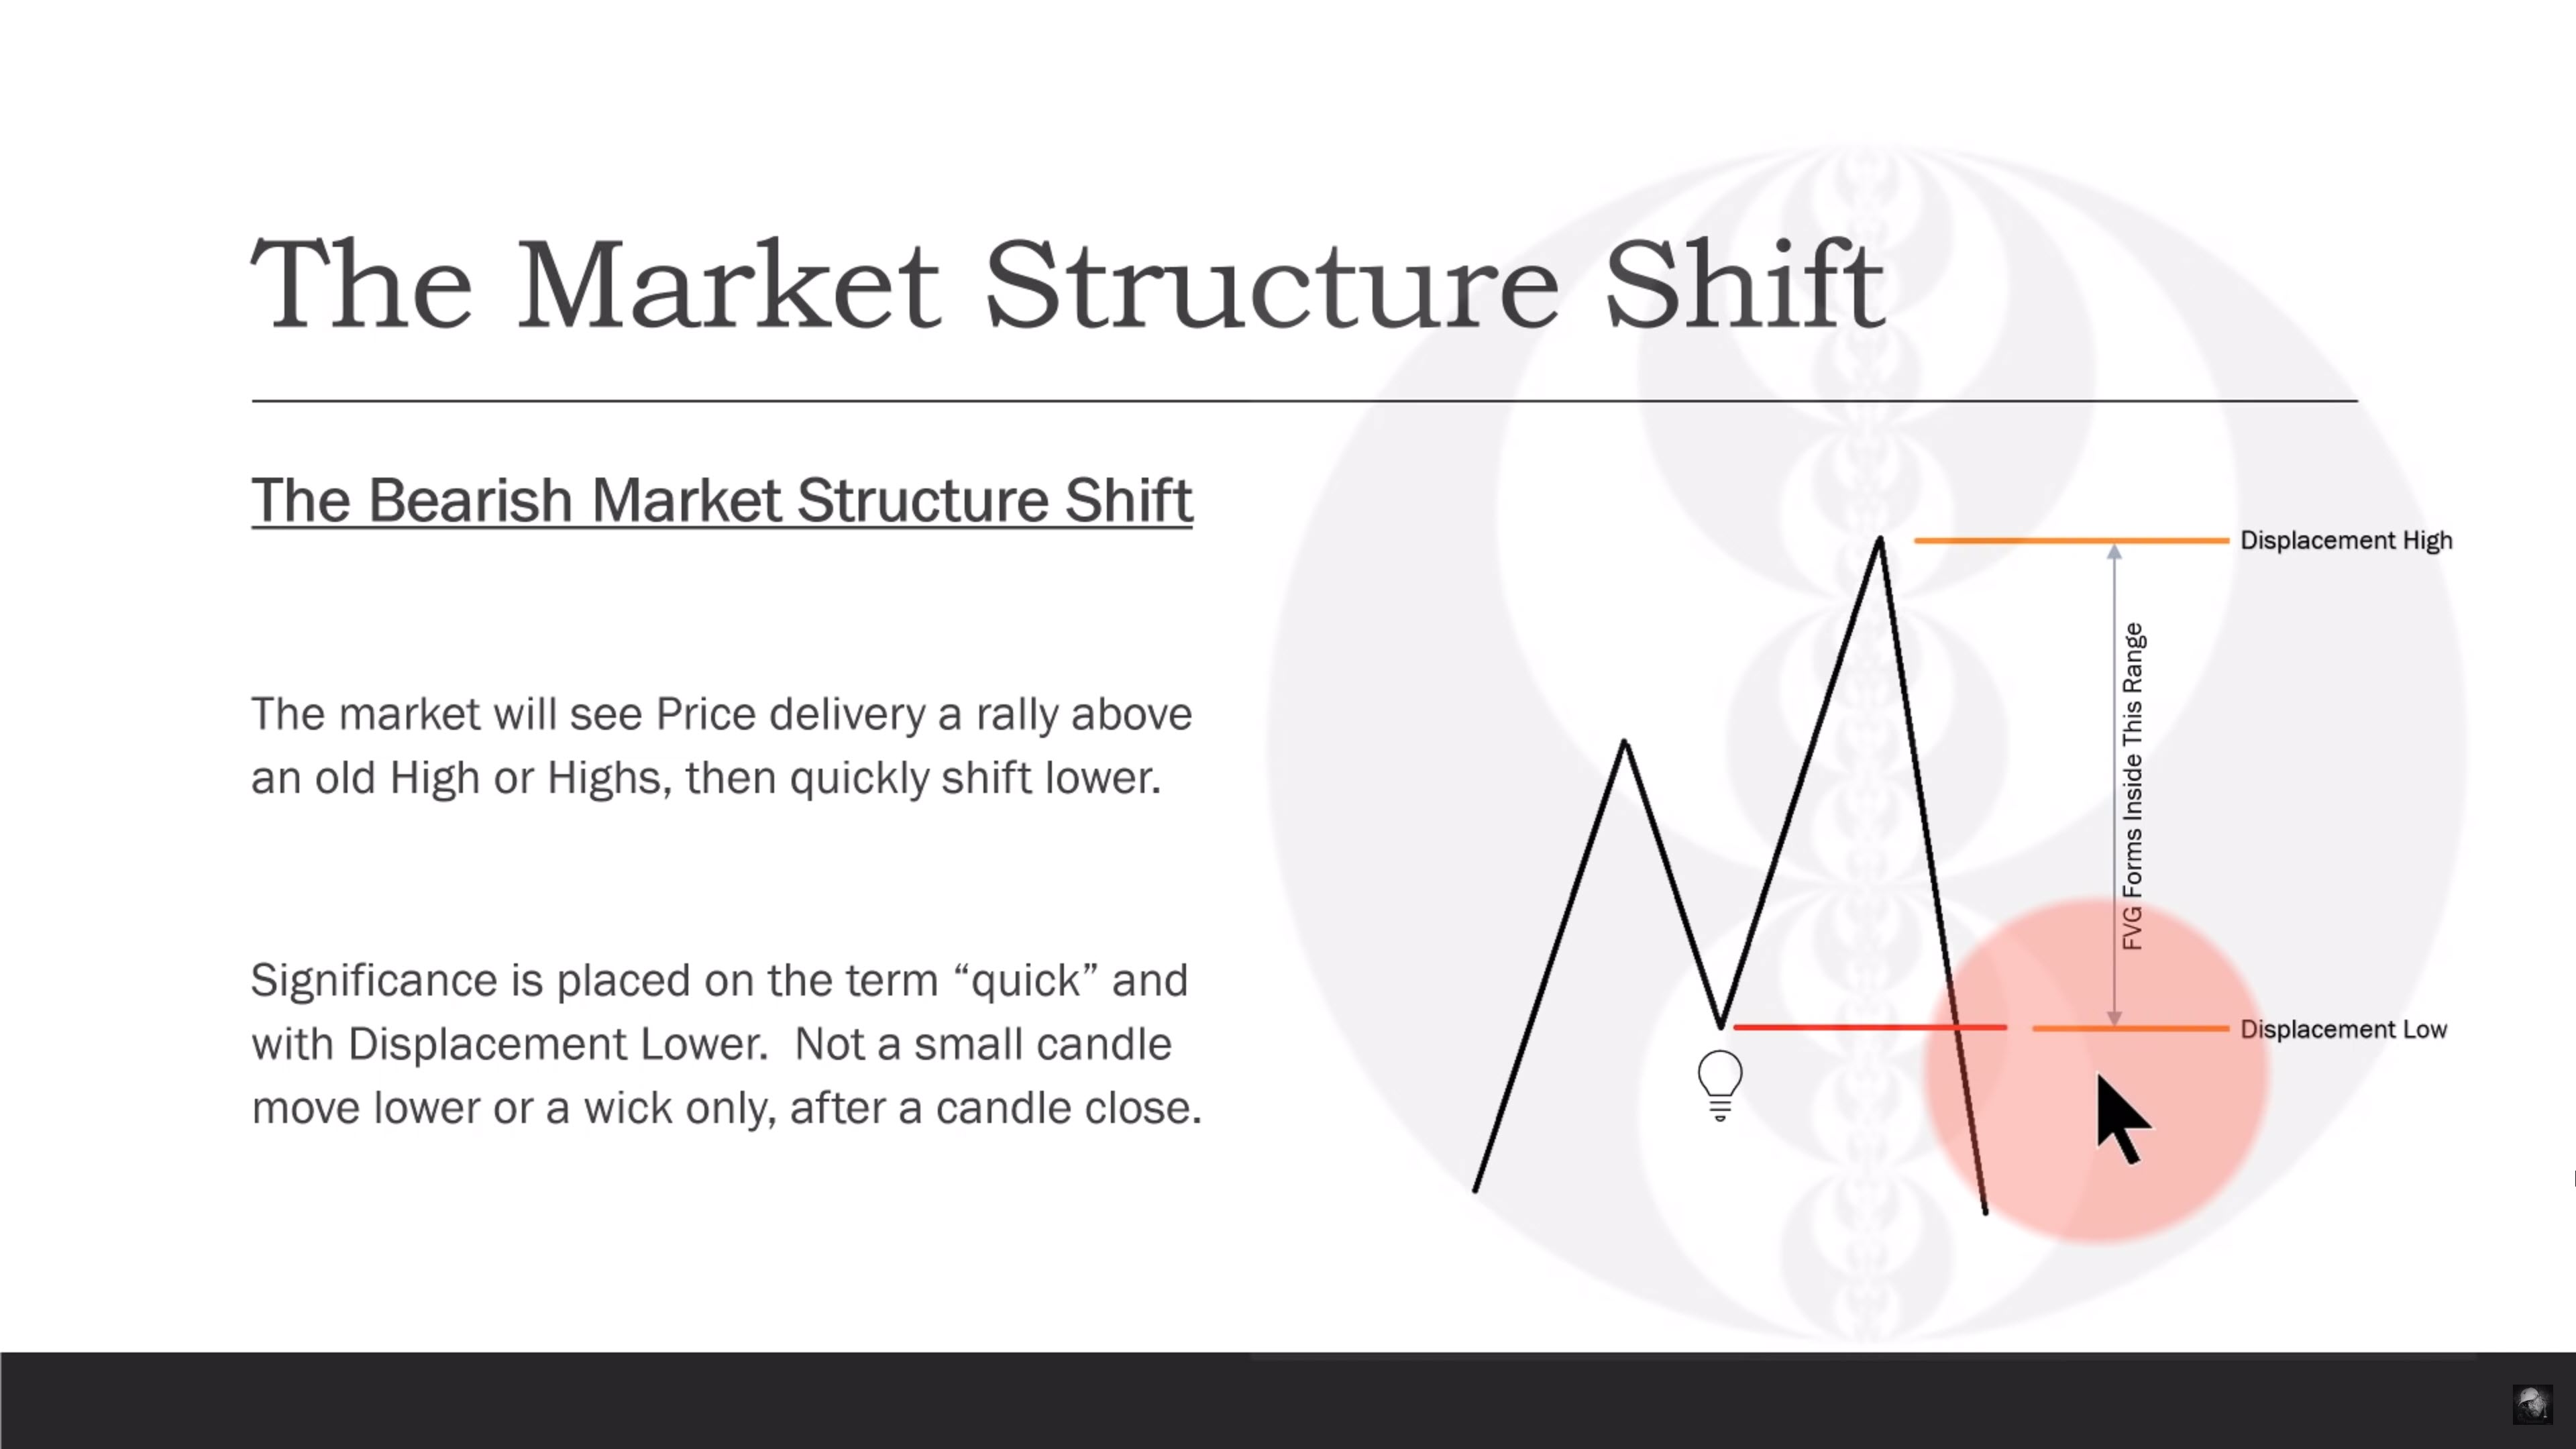
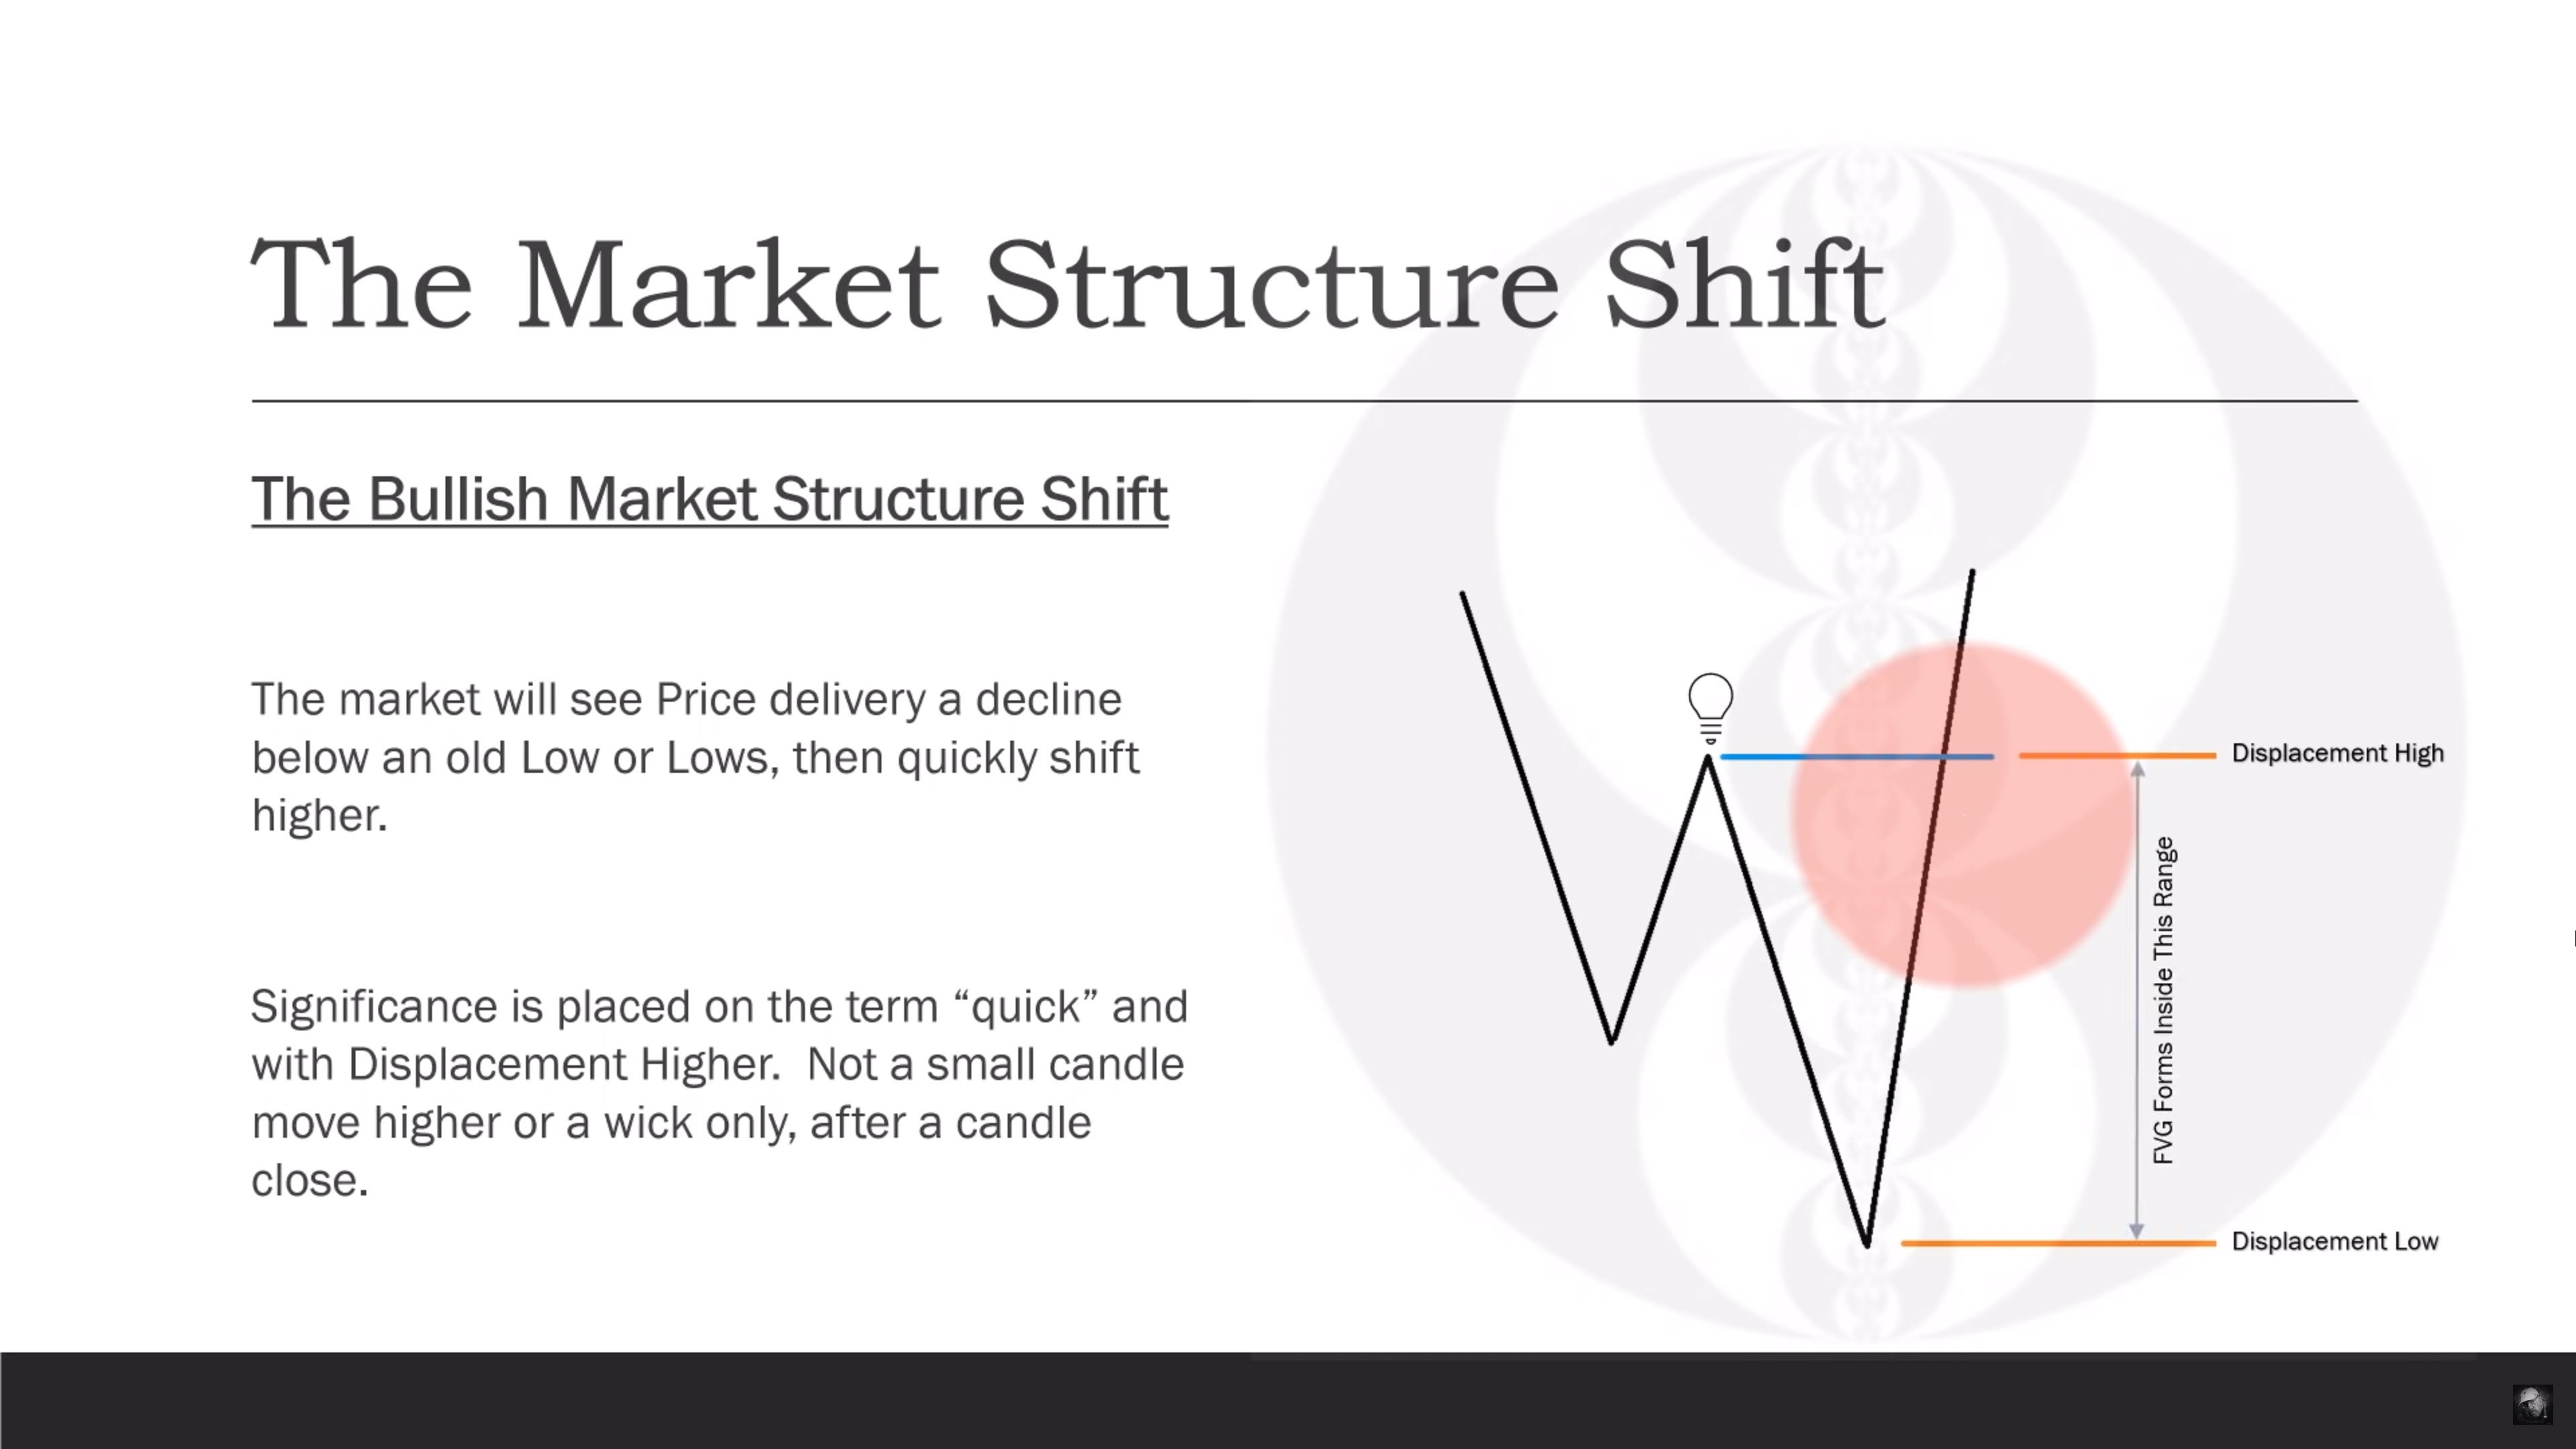
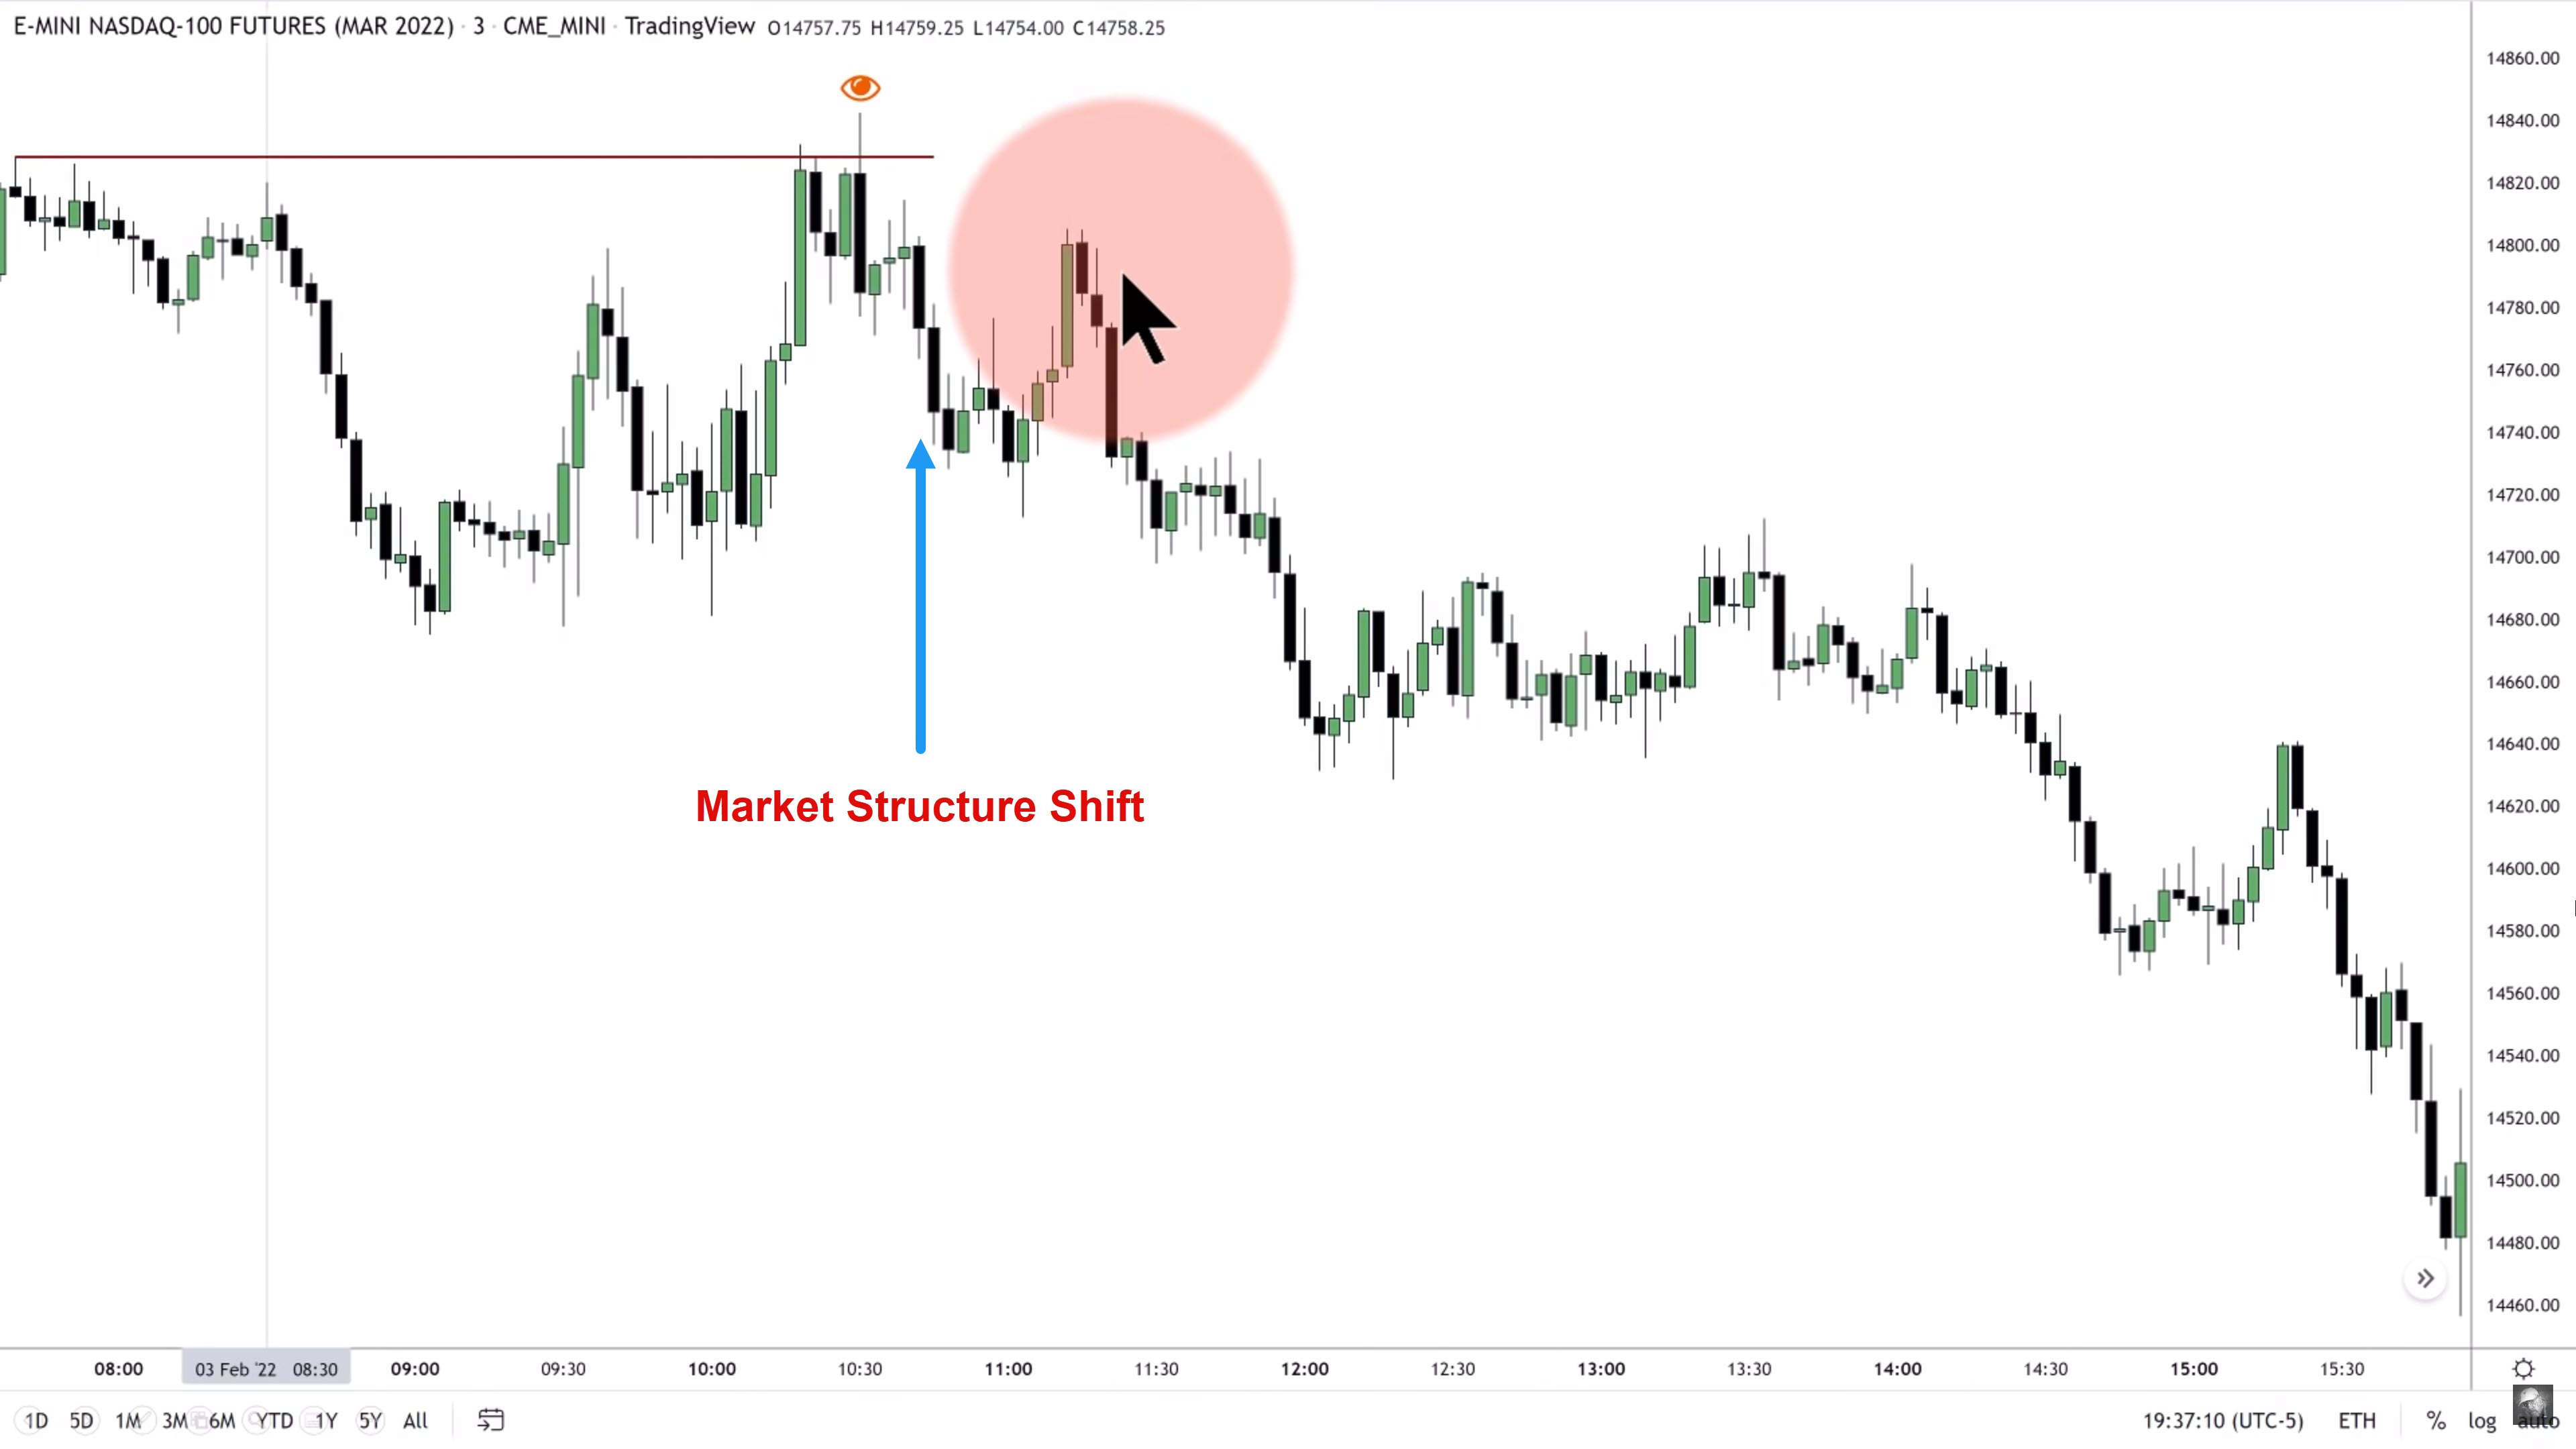
- Market structure shift should be accompanied by displacement, which is an energetic and quick movement.
- Displacement always closes below the swing low in the case of a bearish market structure shift and above the swing high in the case of a bullish market structure shift.
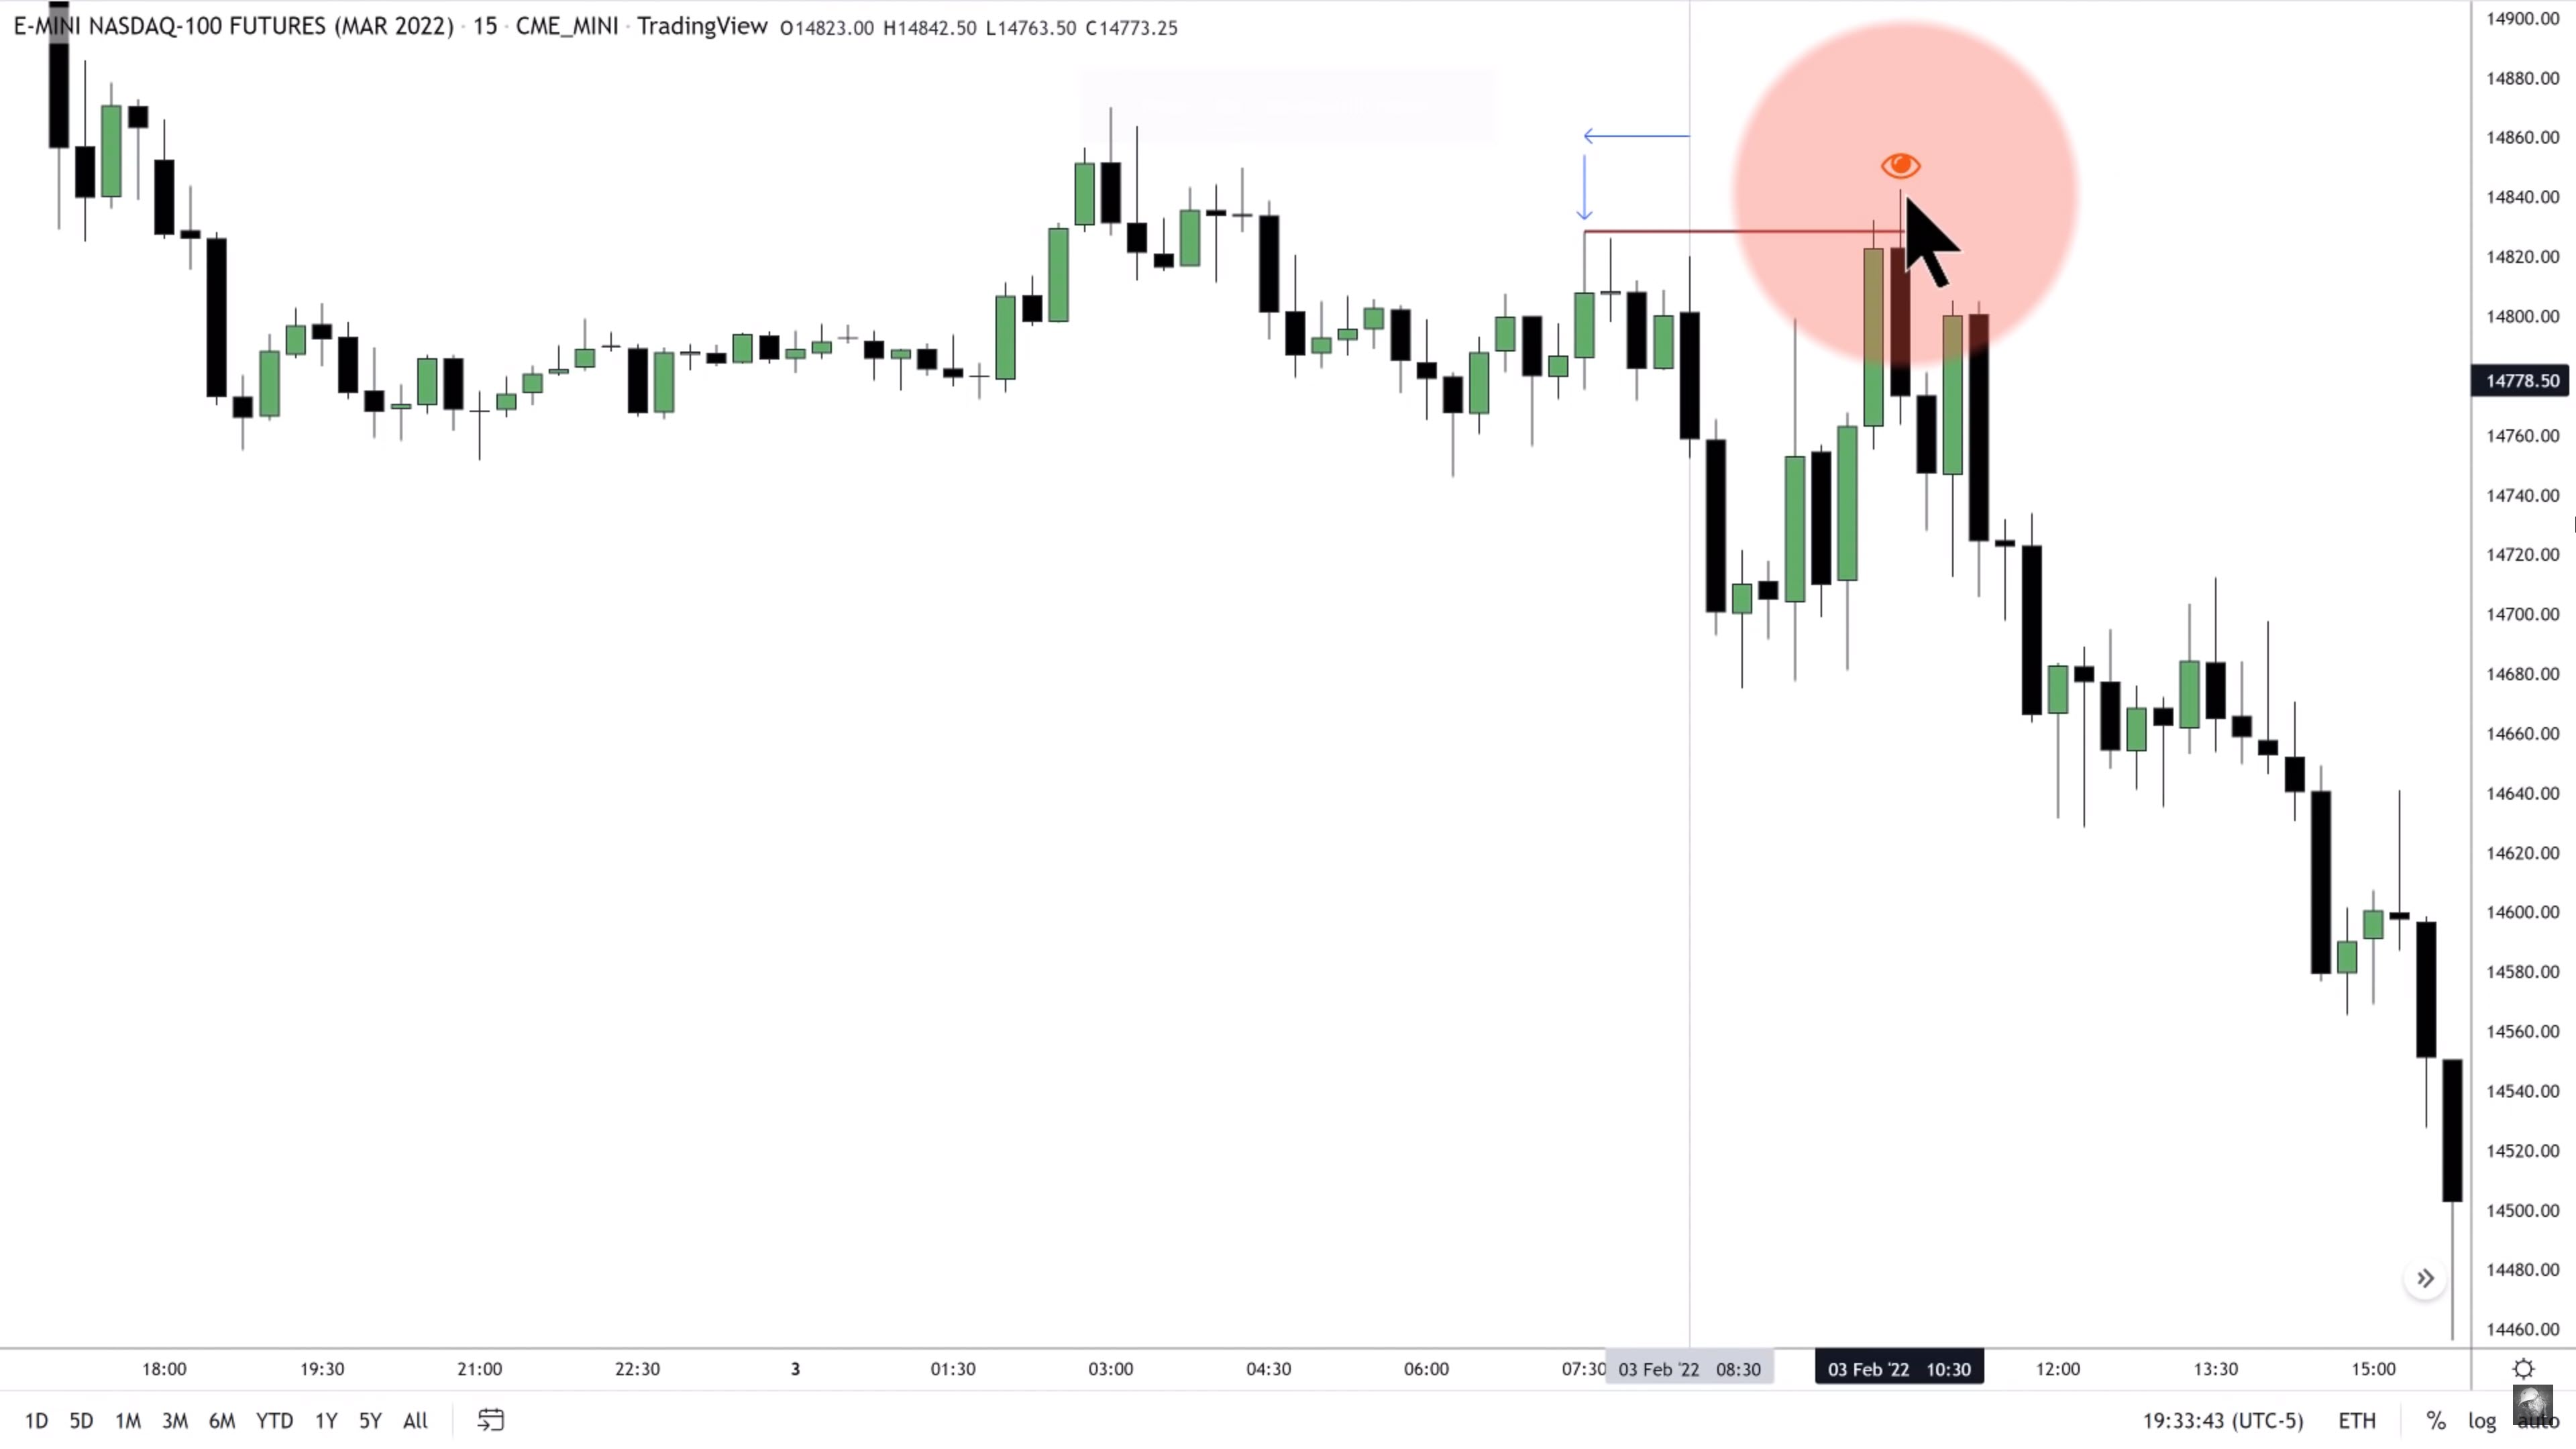
- Since we start looking for our setup at 8:30, we will mark all significant swing highs and lows on the 15-minute chart formed by this time.
- In addition to the 1-minute, 2-minute, 3-minute and 5-minute charts, Michael also checks the 4-minute chart. A top-down approach is used, i.e., going from the highest time frame to the lowest.
- If we are bullish, we place our stop loss below the swing low or the low of the first candle, forming the FVG.
- If we are bearish, we place our stop loss above the swing high or the high of the first candle, forming the FVG.
- The initial move that the indices make after the open (after 9:30 a.m.) is usually opposite to the real one that is yet to come.
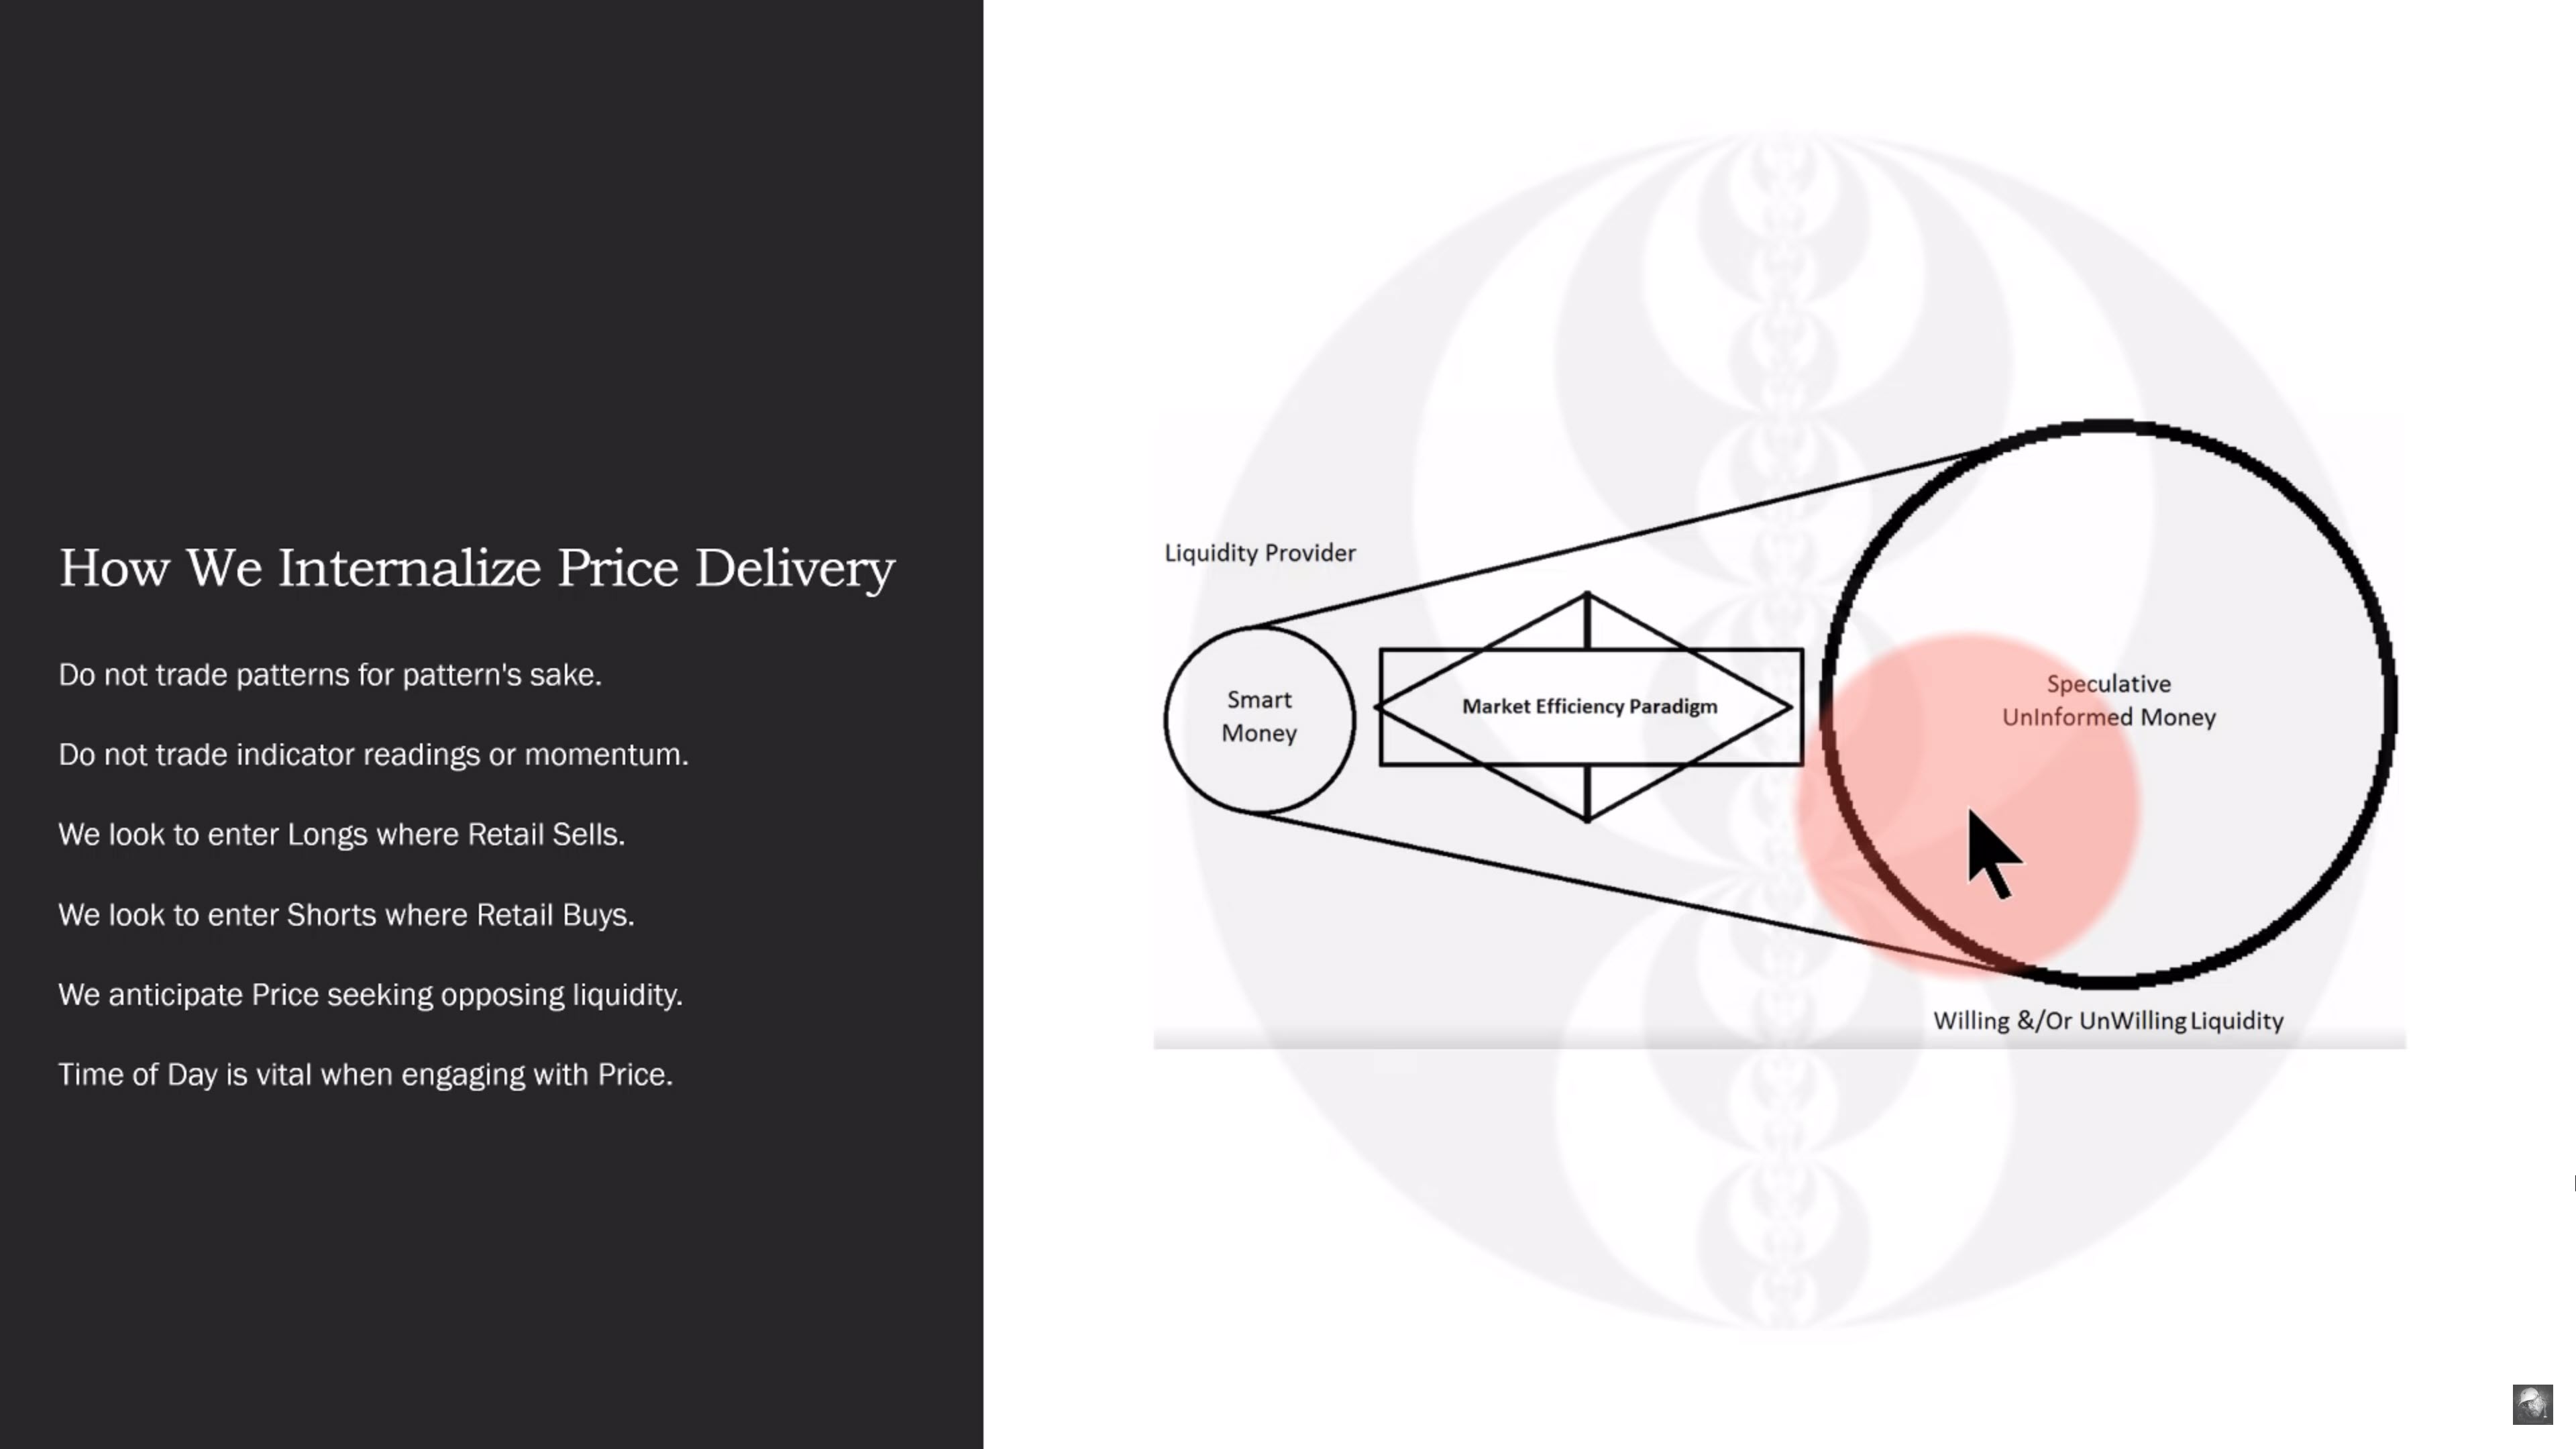
ICT 2022 YouTube Model - How We Internalize Price Delivery
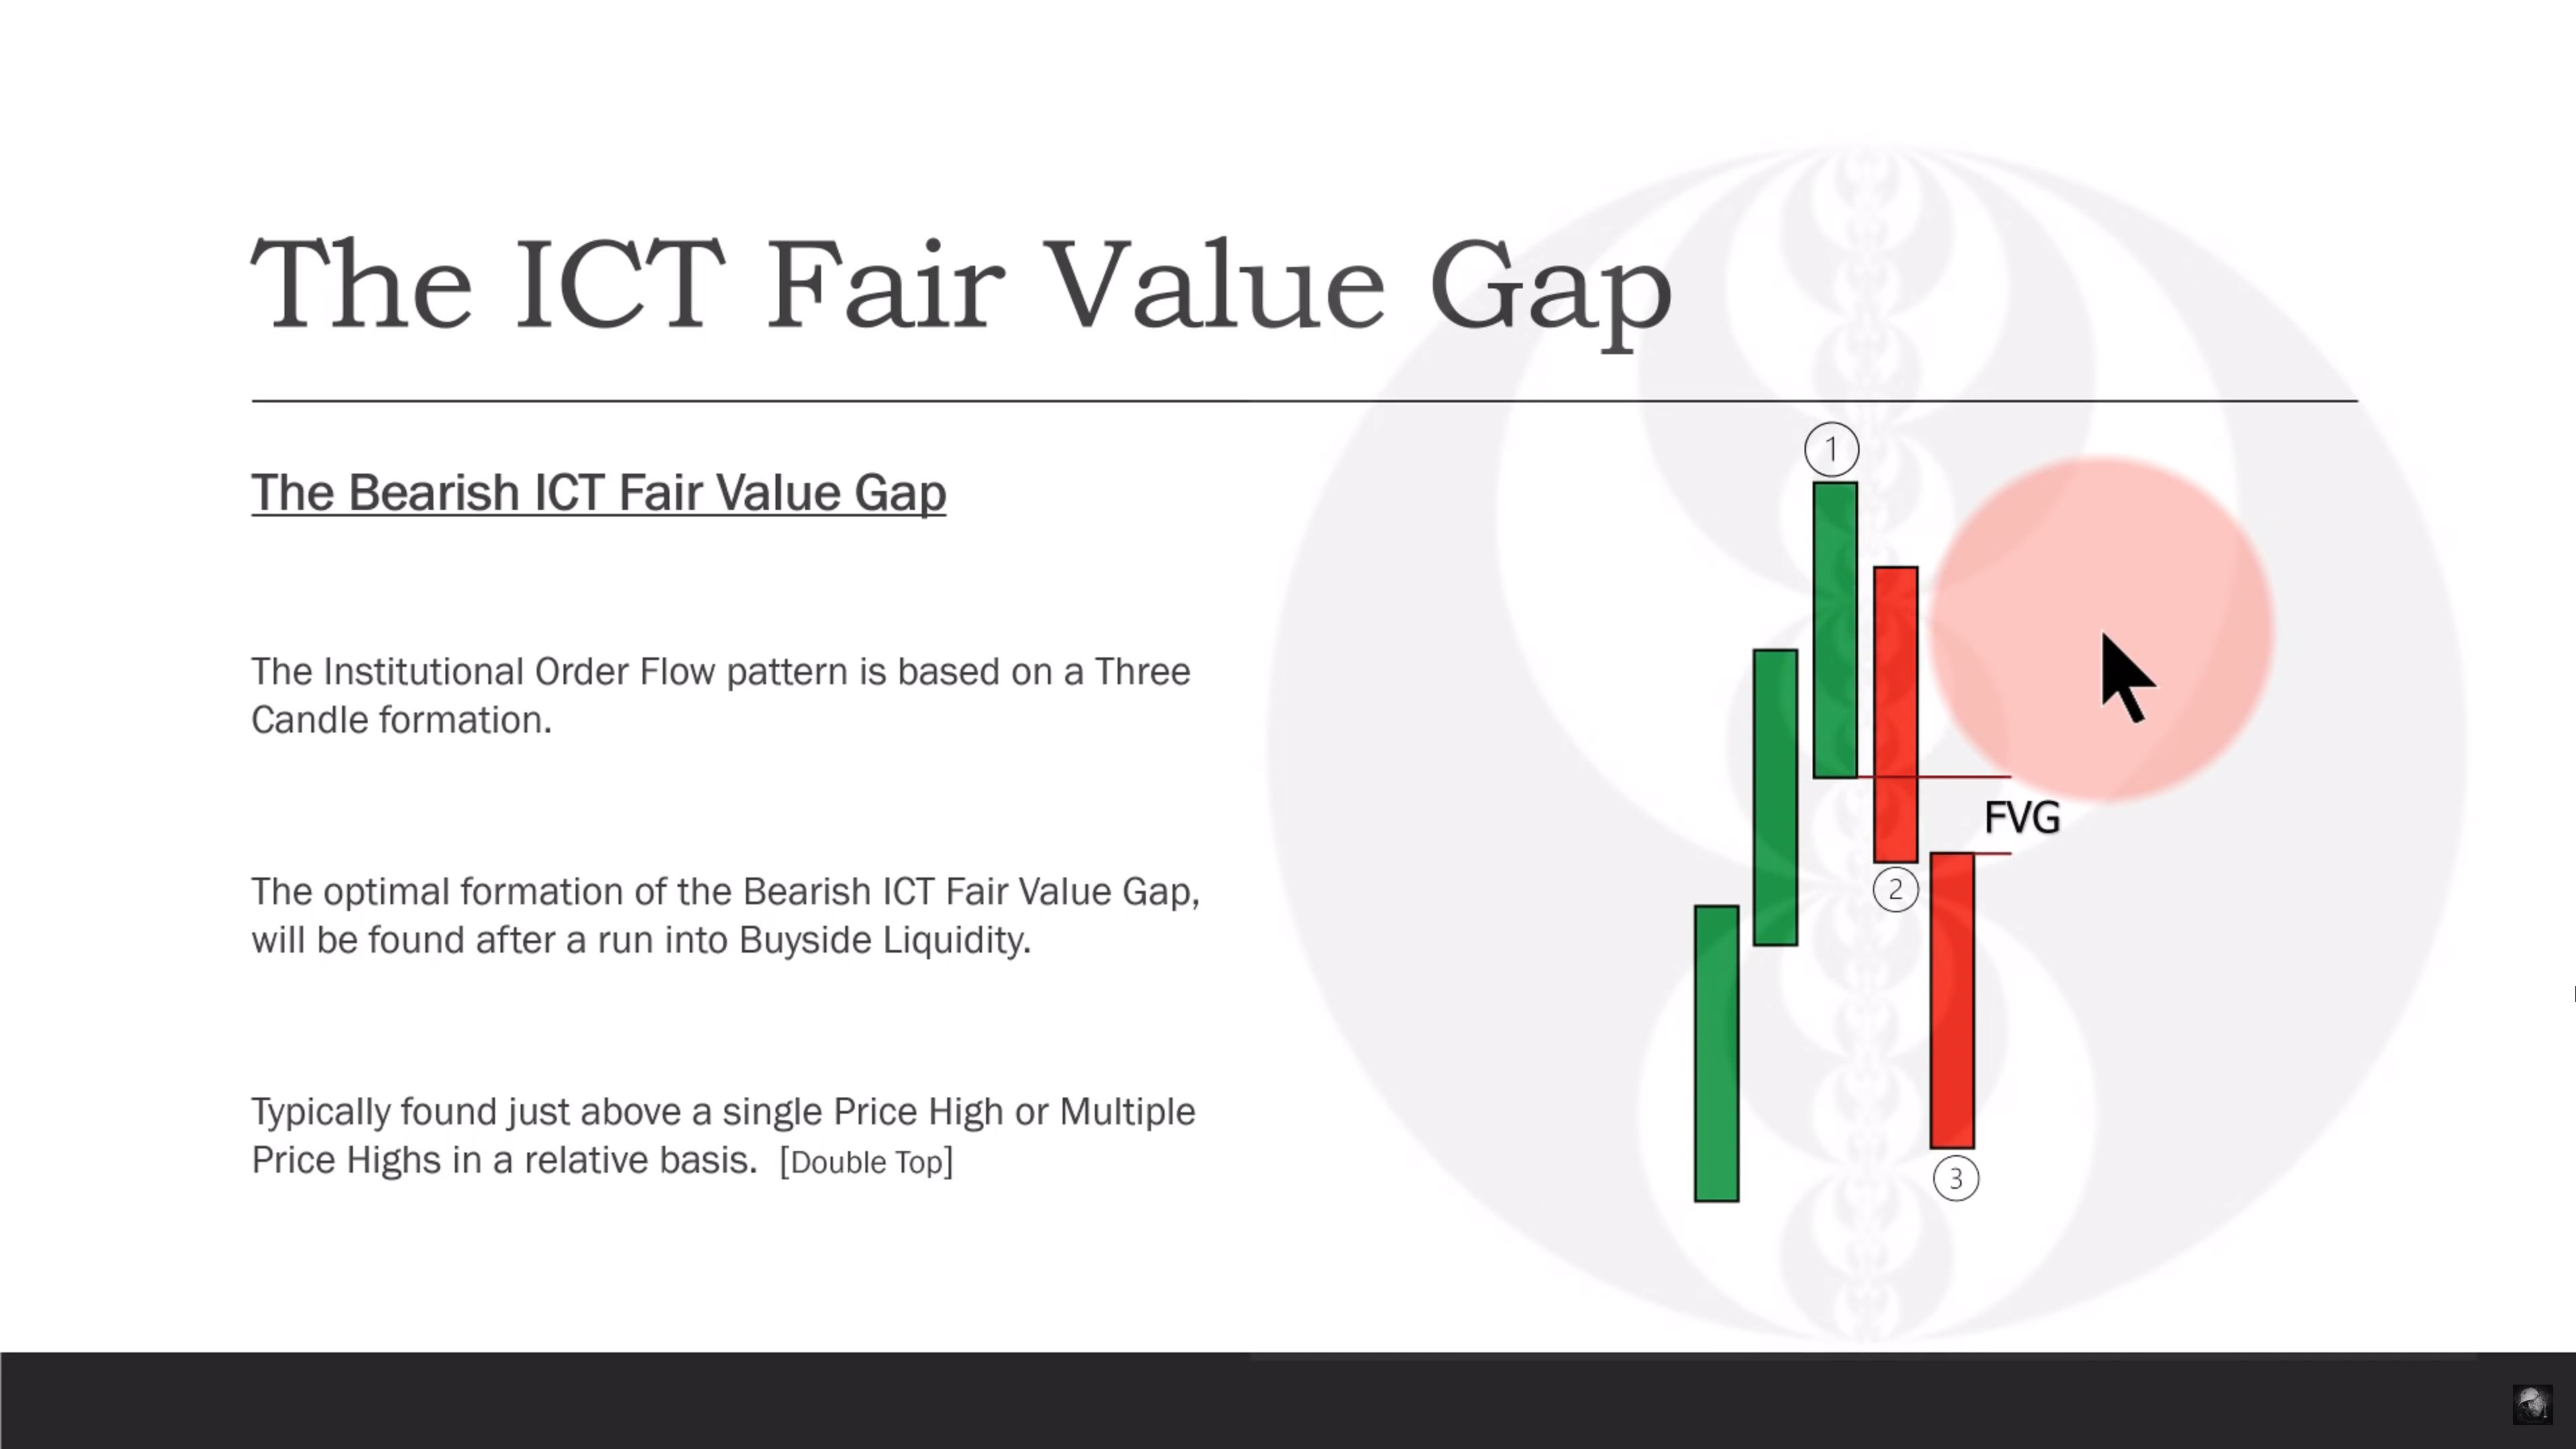
The Bearish ICT Fair Value Gap
The Bearish Market Structure Shift
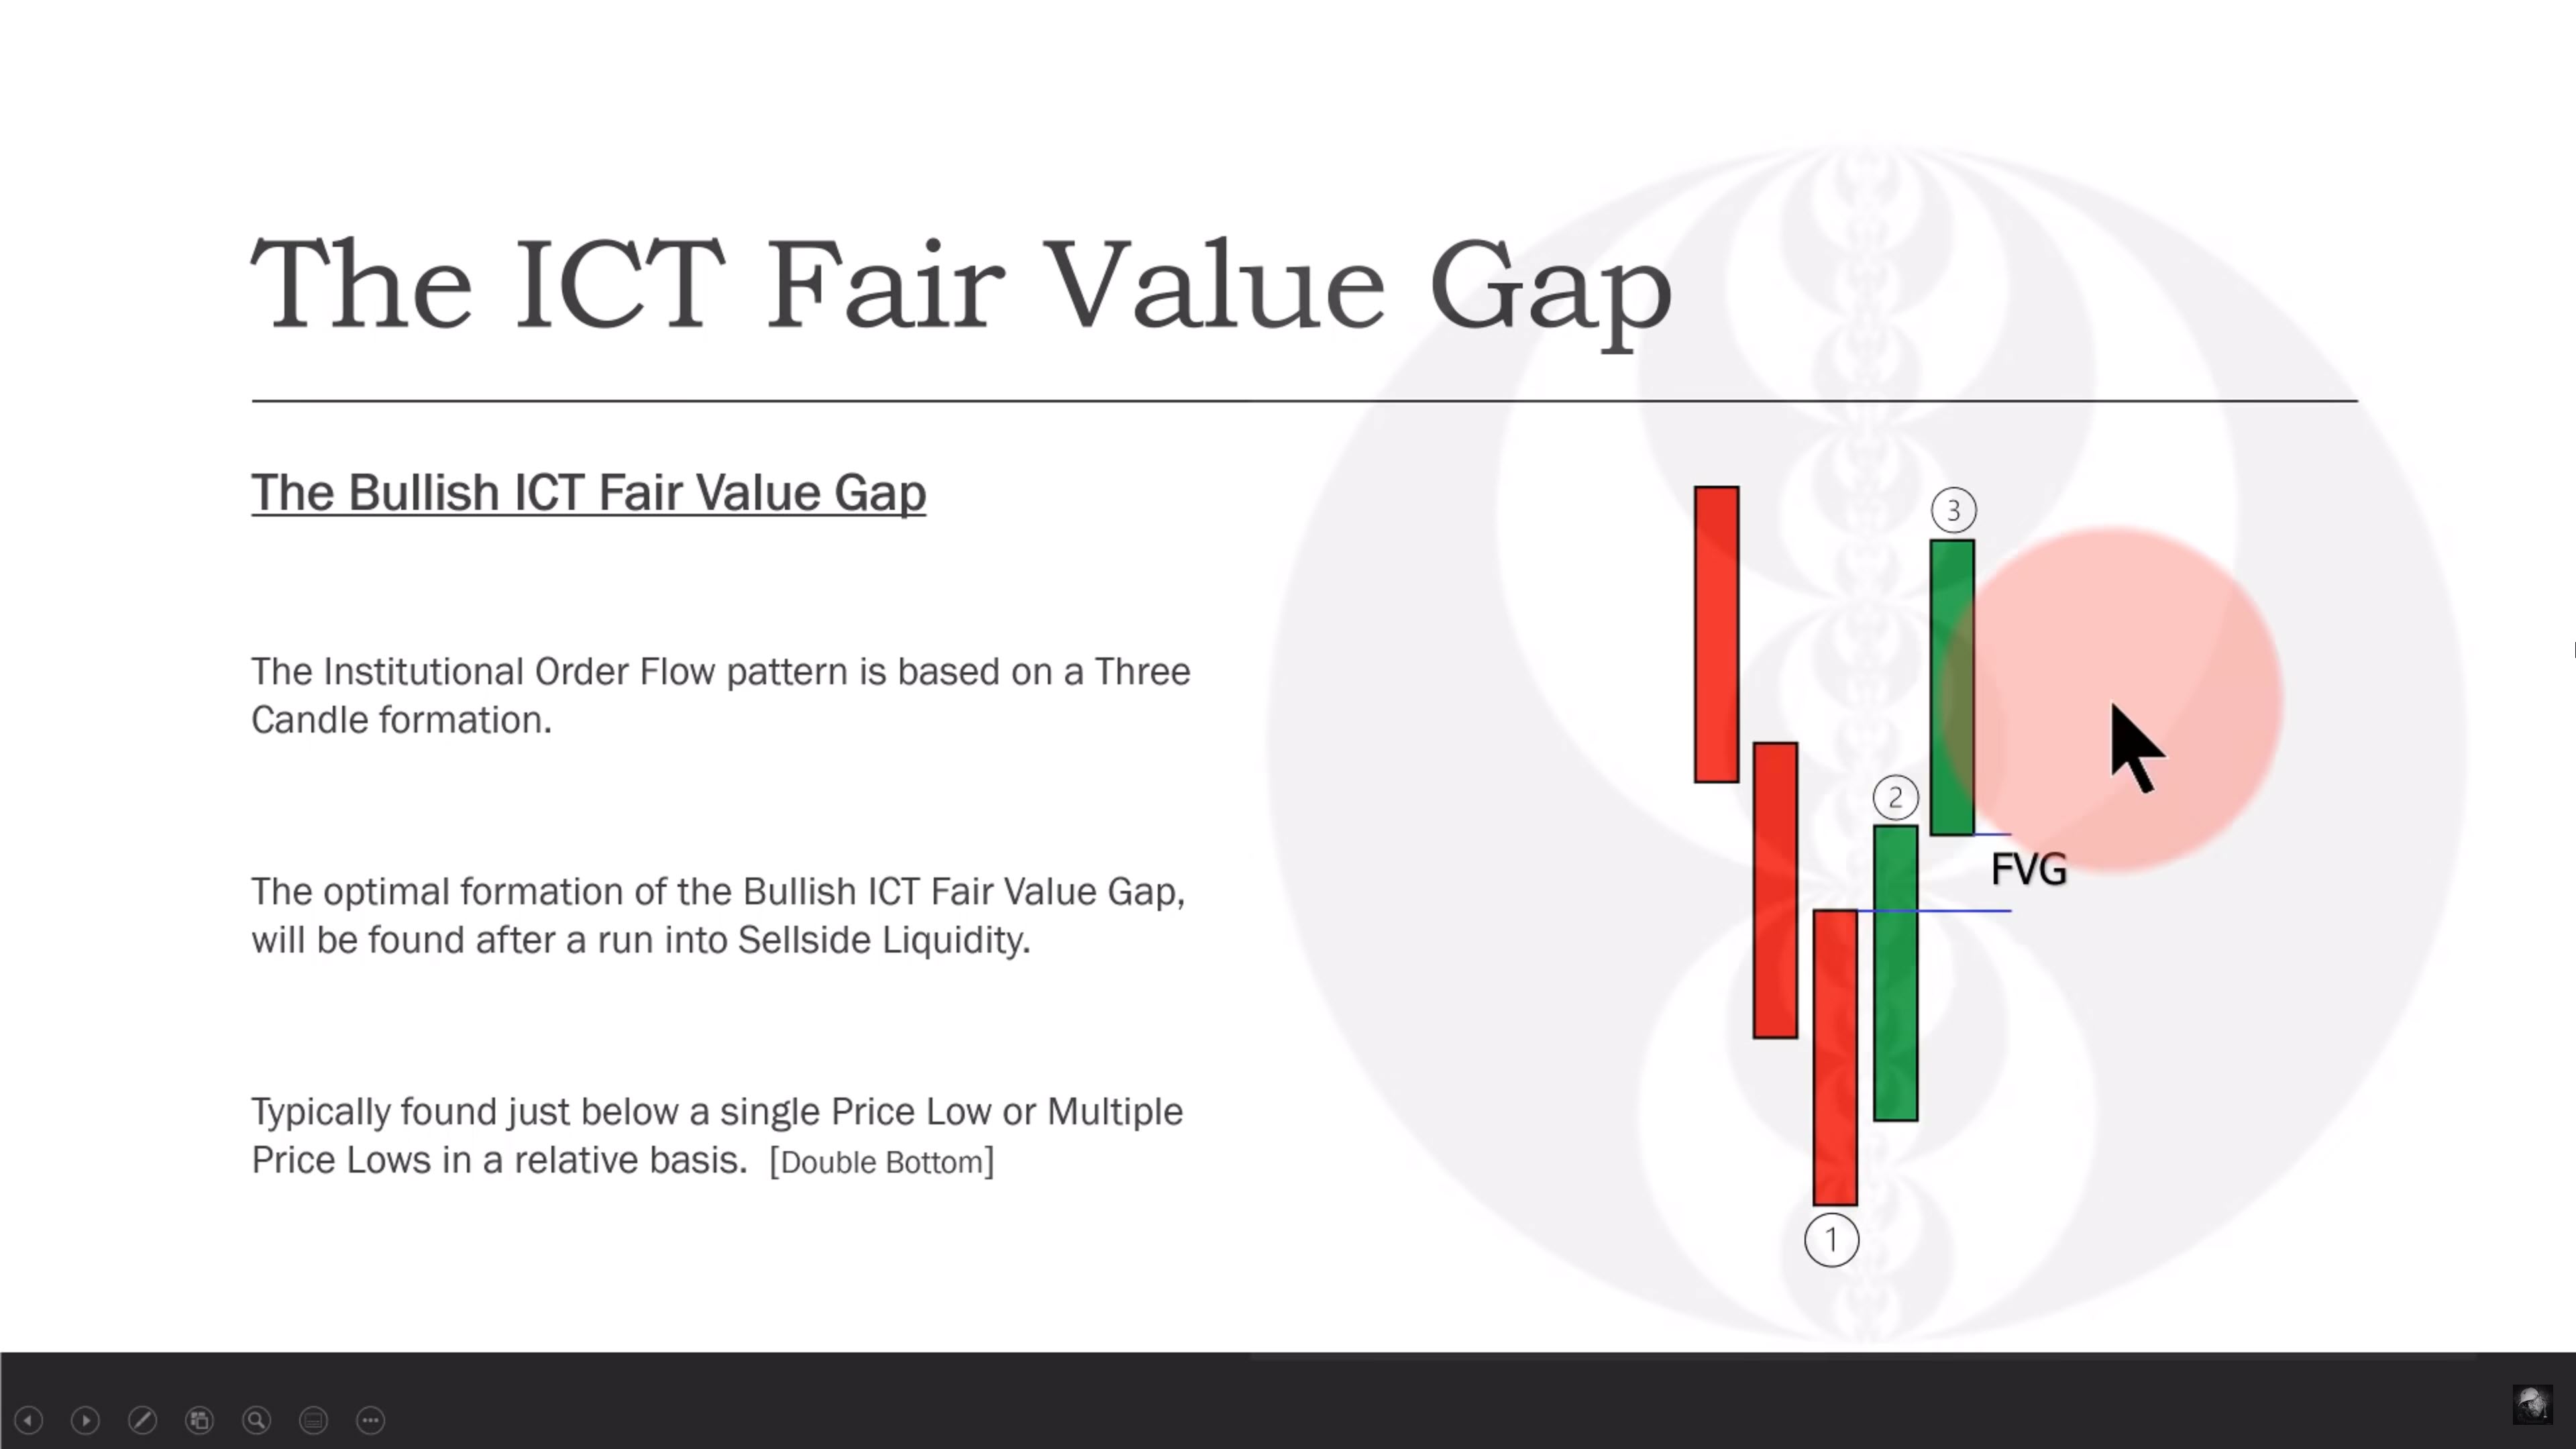
The Bullish ICT Fair Value Gap
The Bullish Market Structure Shift
ICT 2022 YouTube Model - NQ 15-Minute Buyside Liquidity
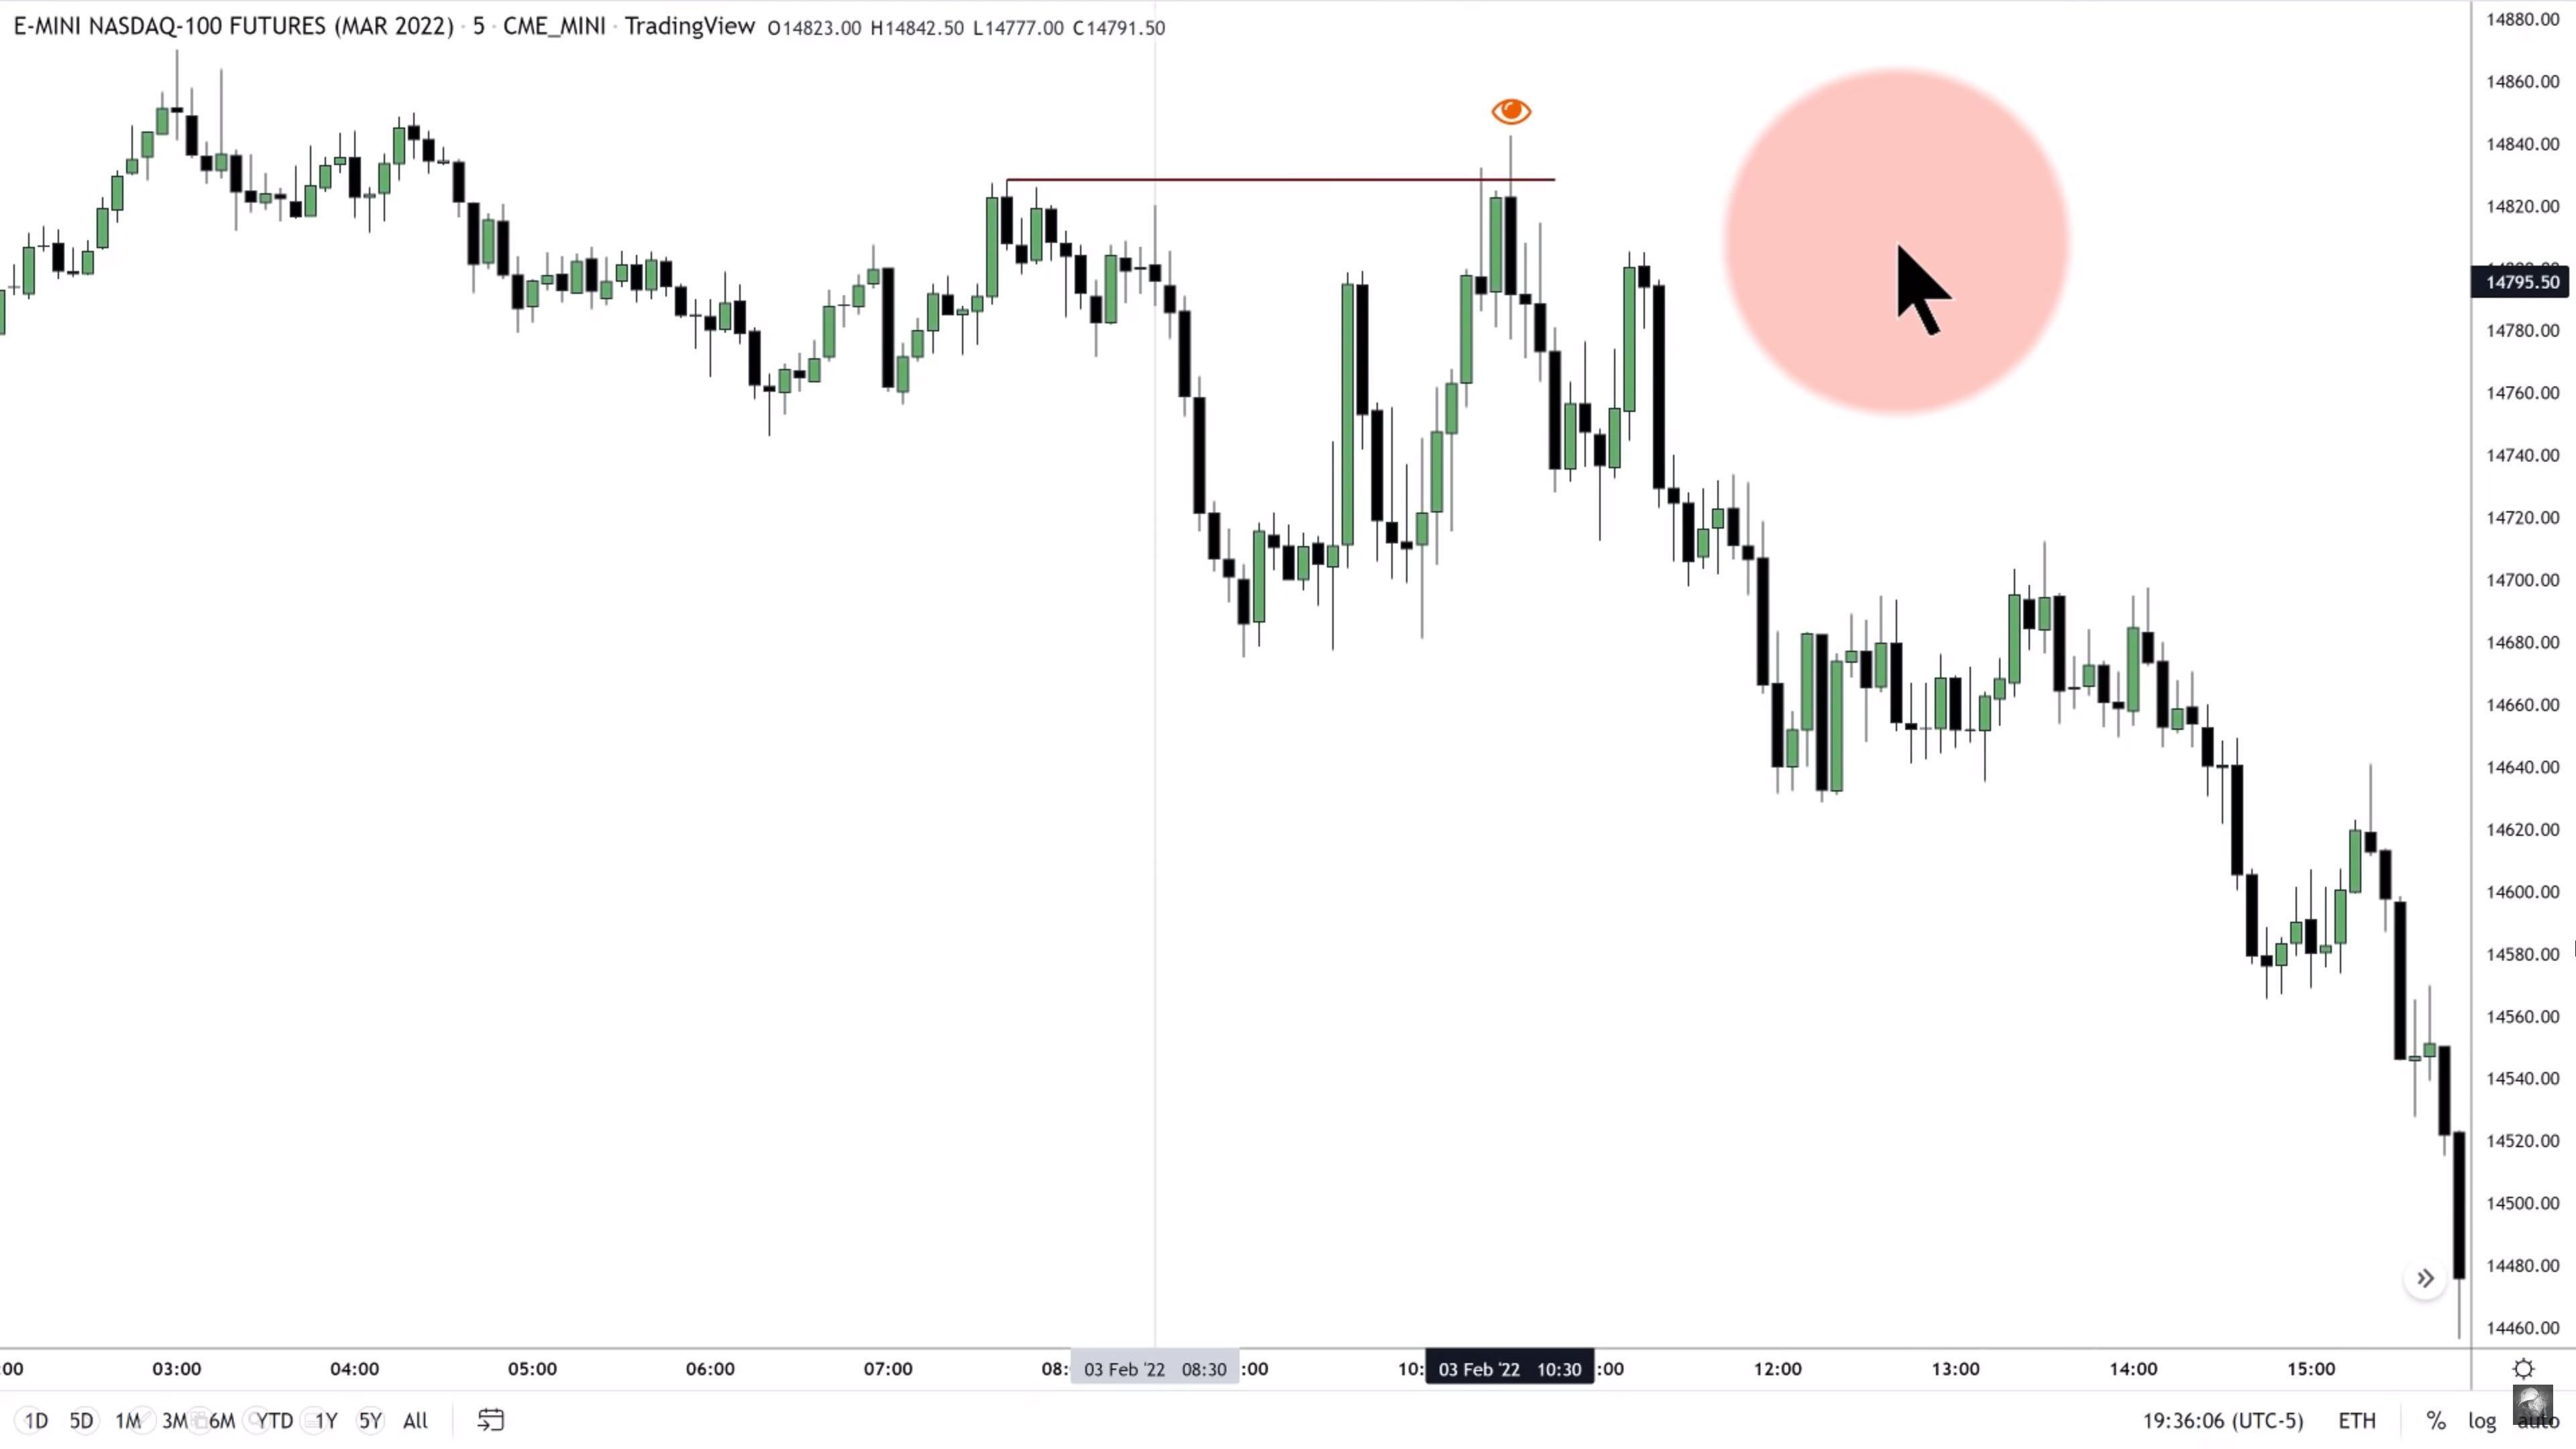
ICT 2022 YouTube Model - NQ 5-Minute Chart
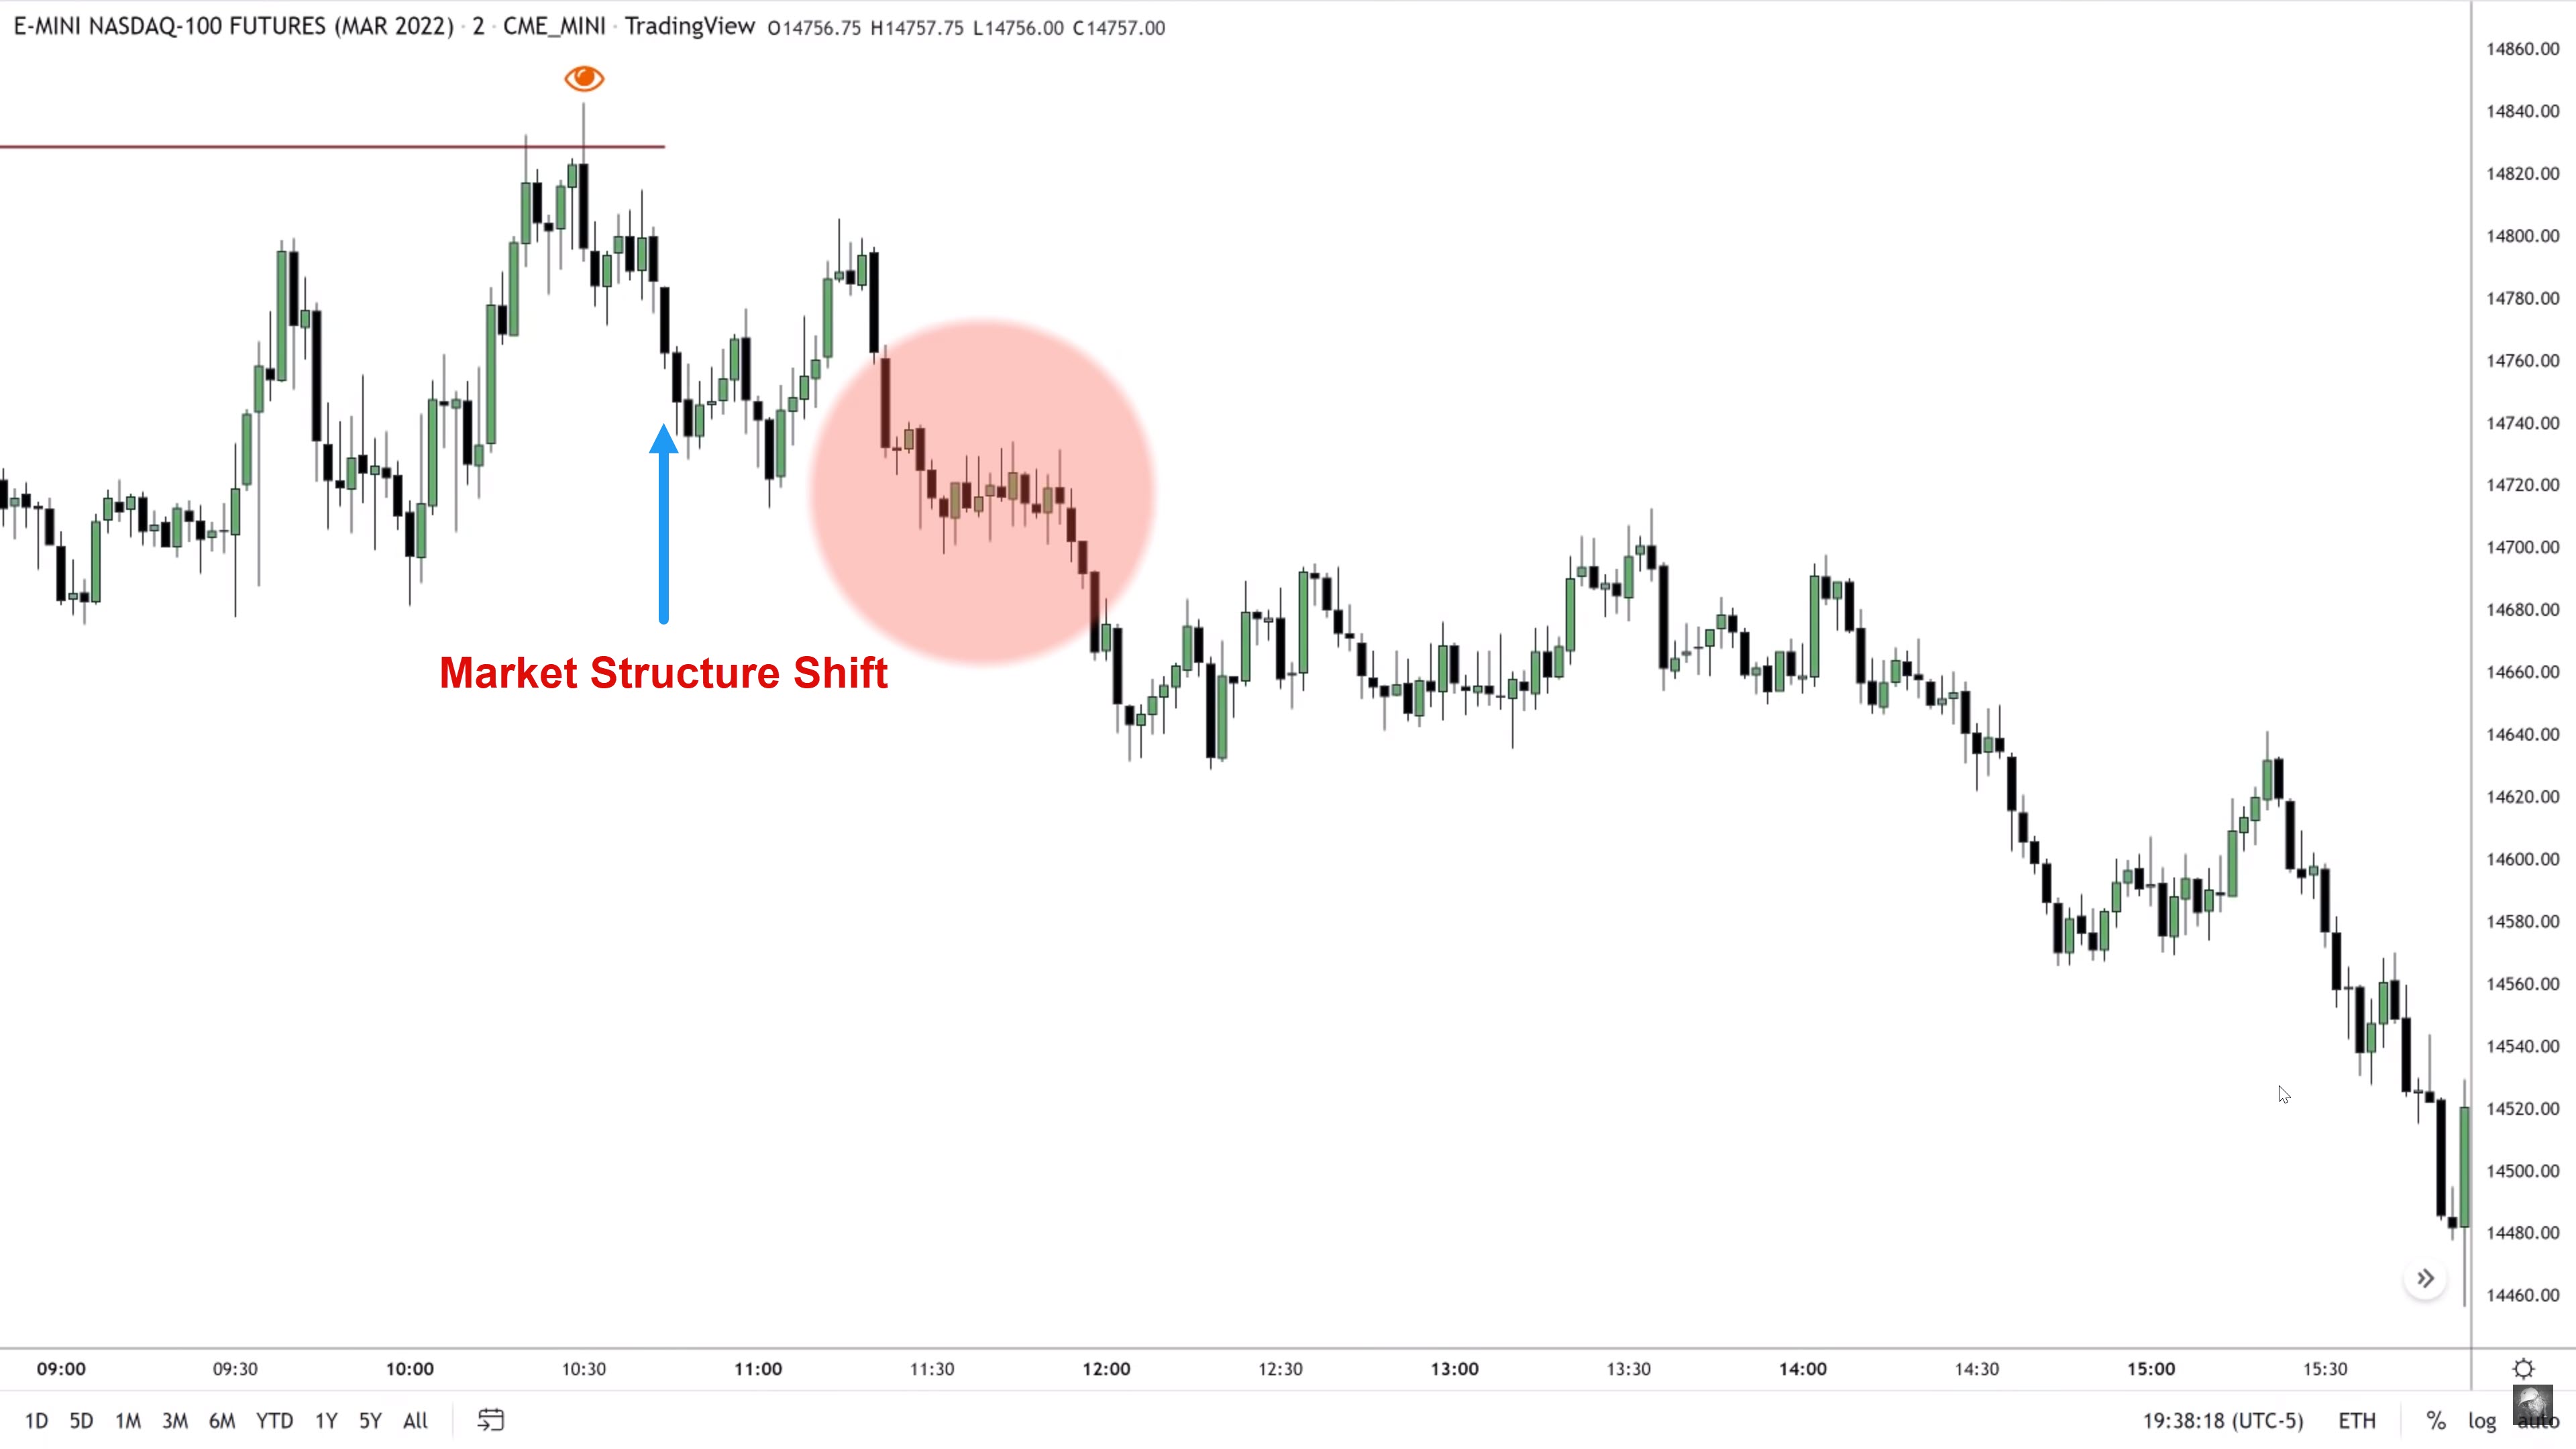
ICT 2022 YouTube Model - NQ 3-Minute Market Structure Shift
ICT 2022 YouTube Model - NQ 2-Minute Market Structure Shift
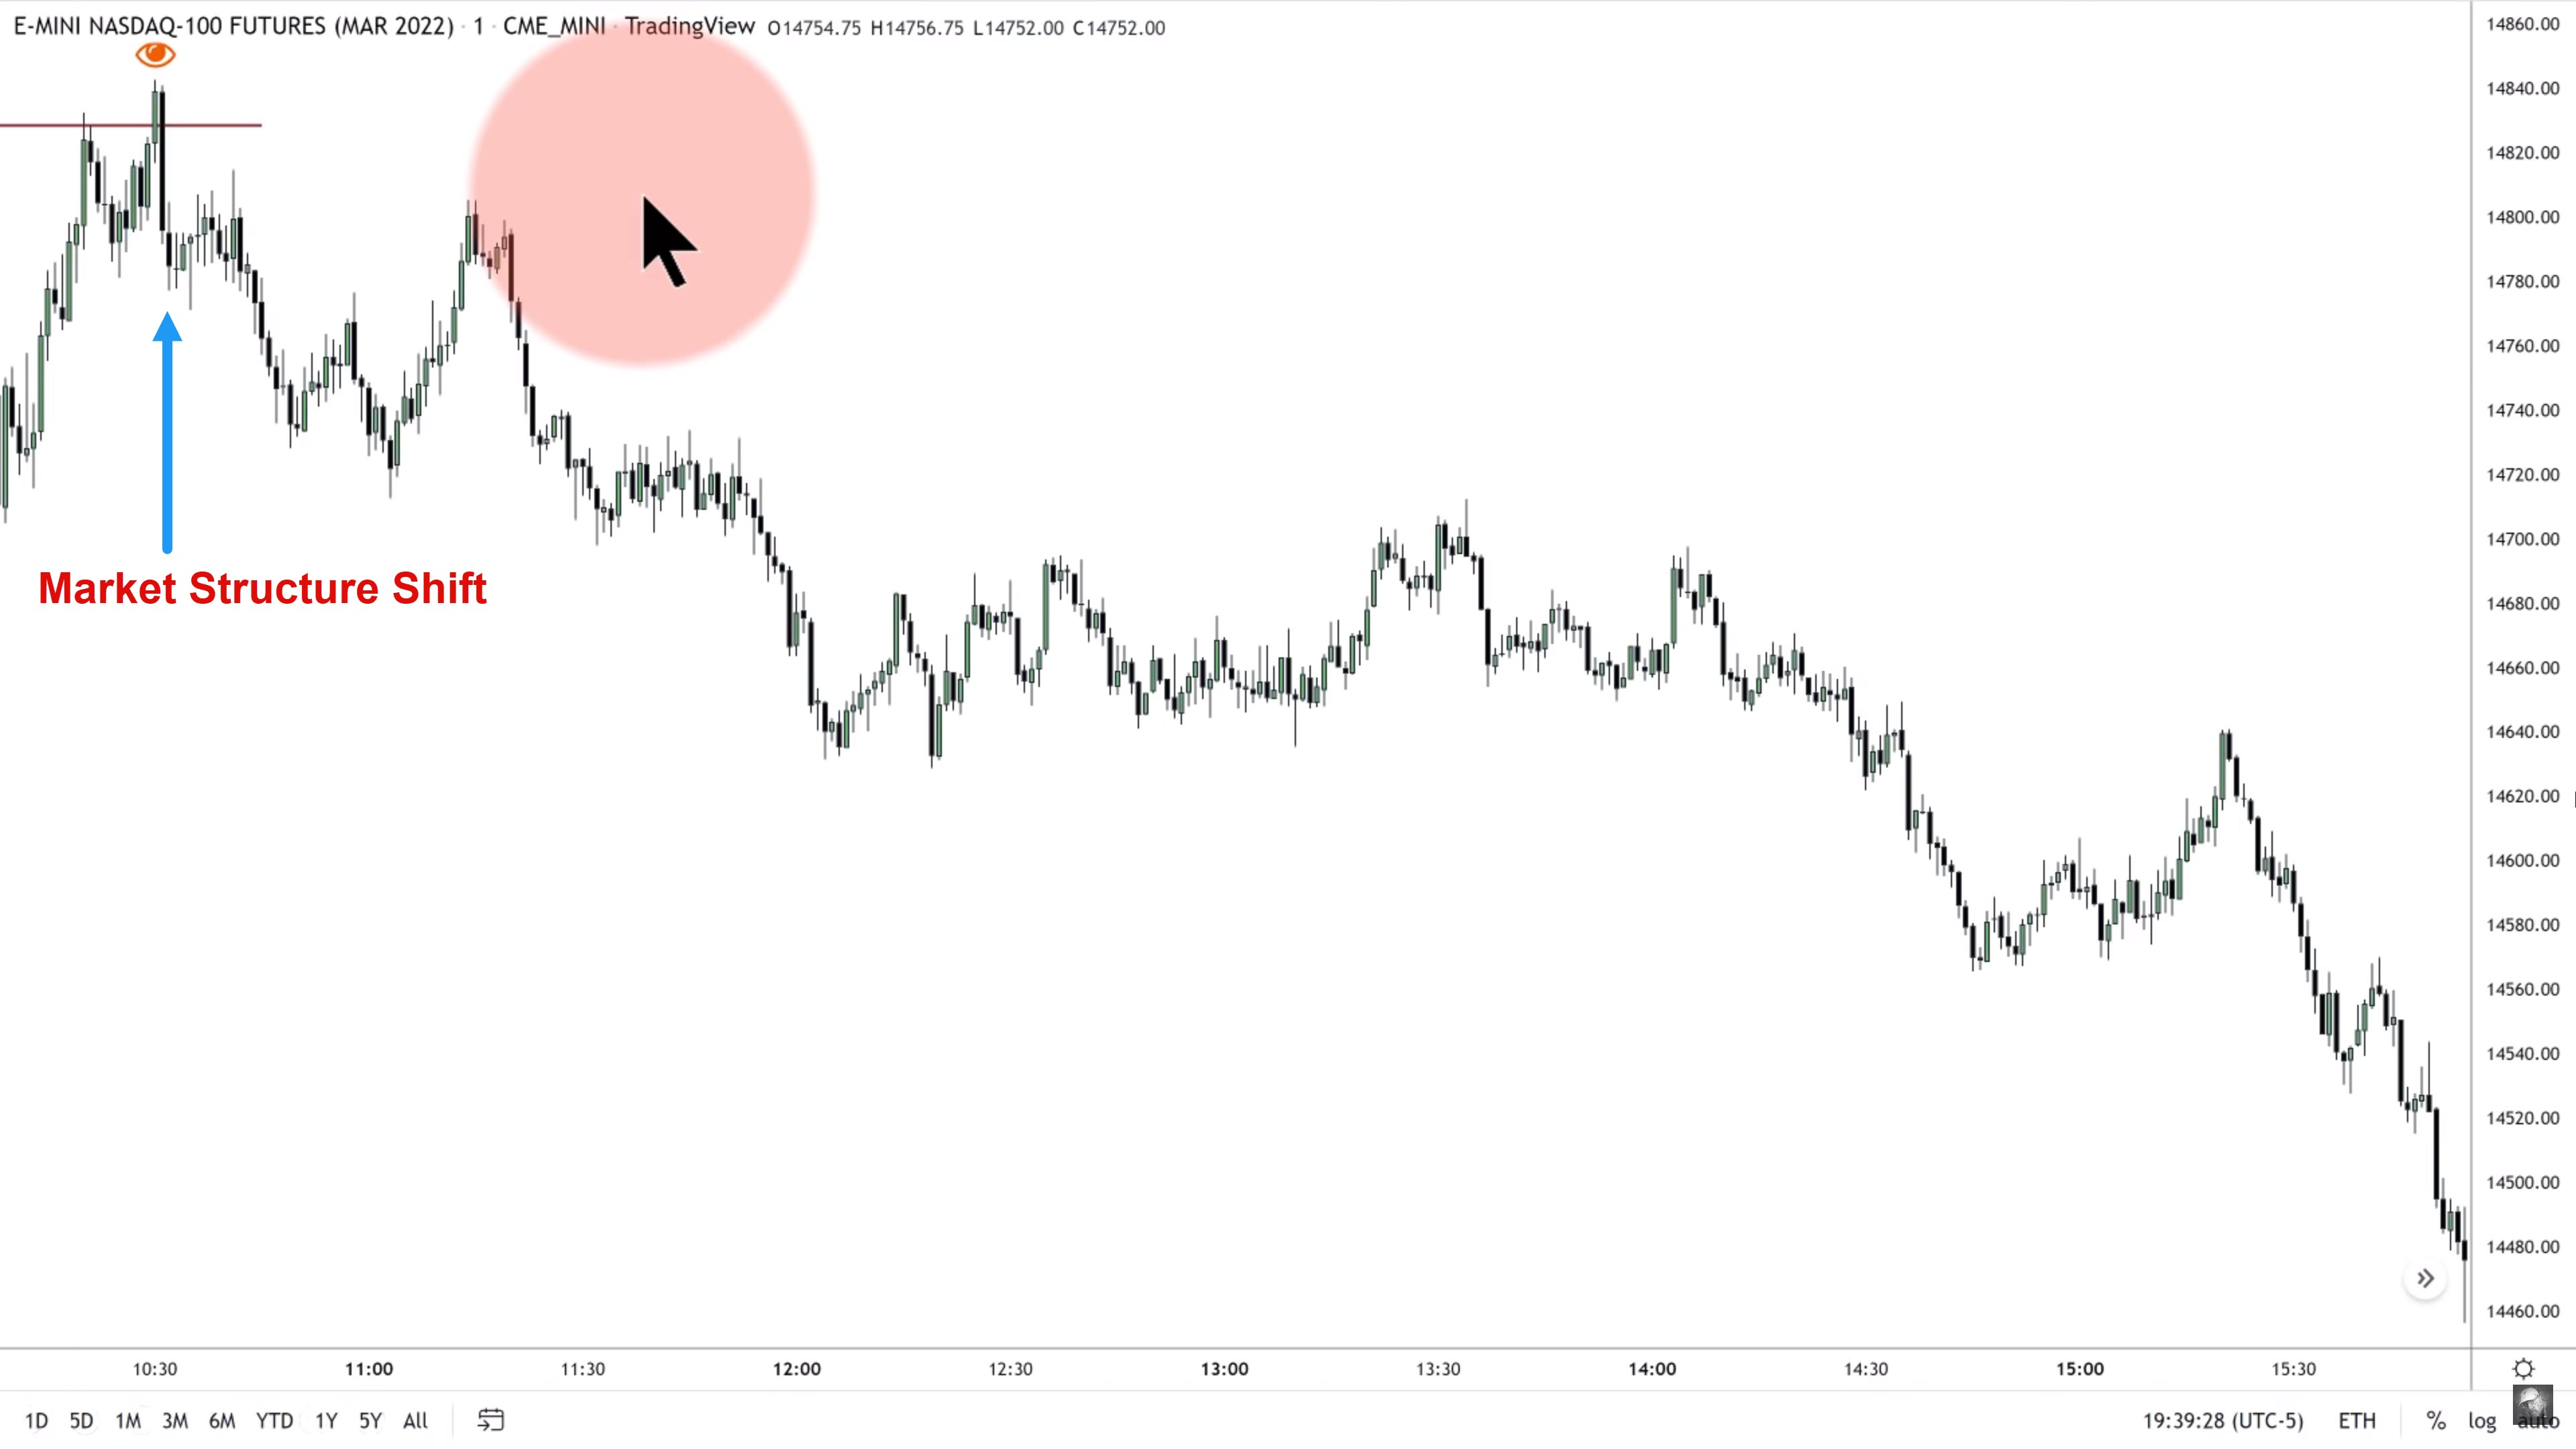
ICT 2022 YouTube Model - NQ 1-Minute Market Structure Shift
Next lesson: 2022 ICT Mentorship - Episode 7 - Daily Bias & Consolidation Hurdles
Previous lesson: 2022 ICT Mentorship - Episode 5 - Intraday Order Flow & Understanding The Daily Range