
Notes
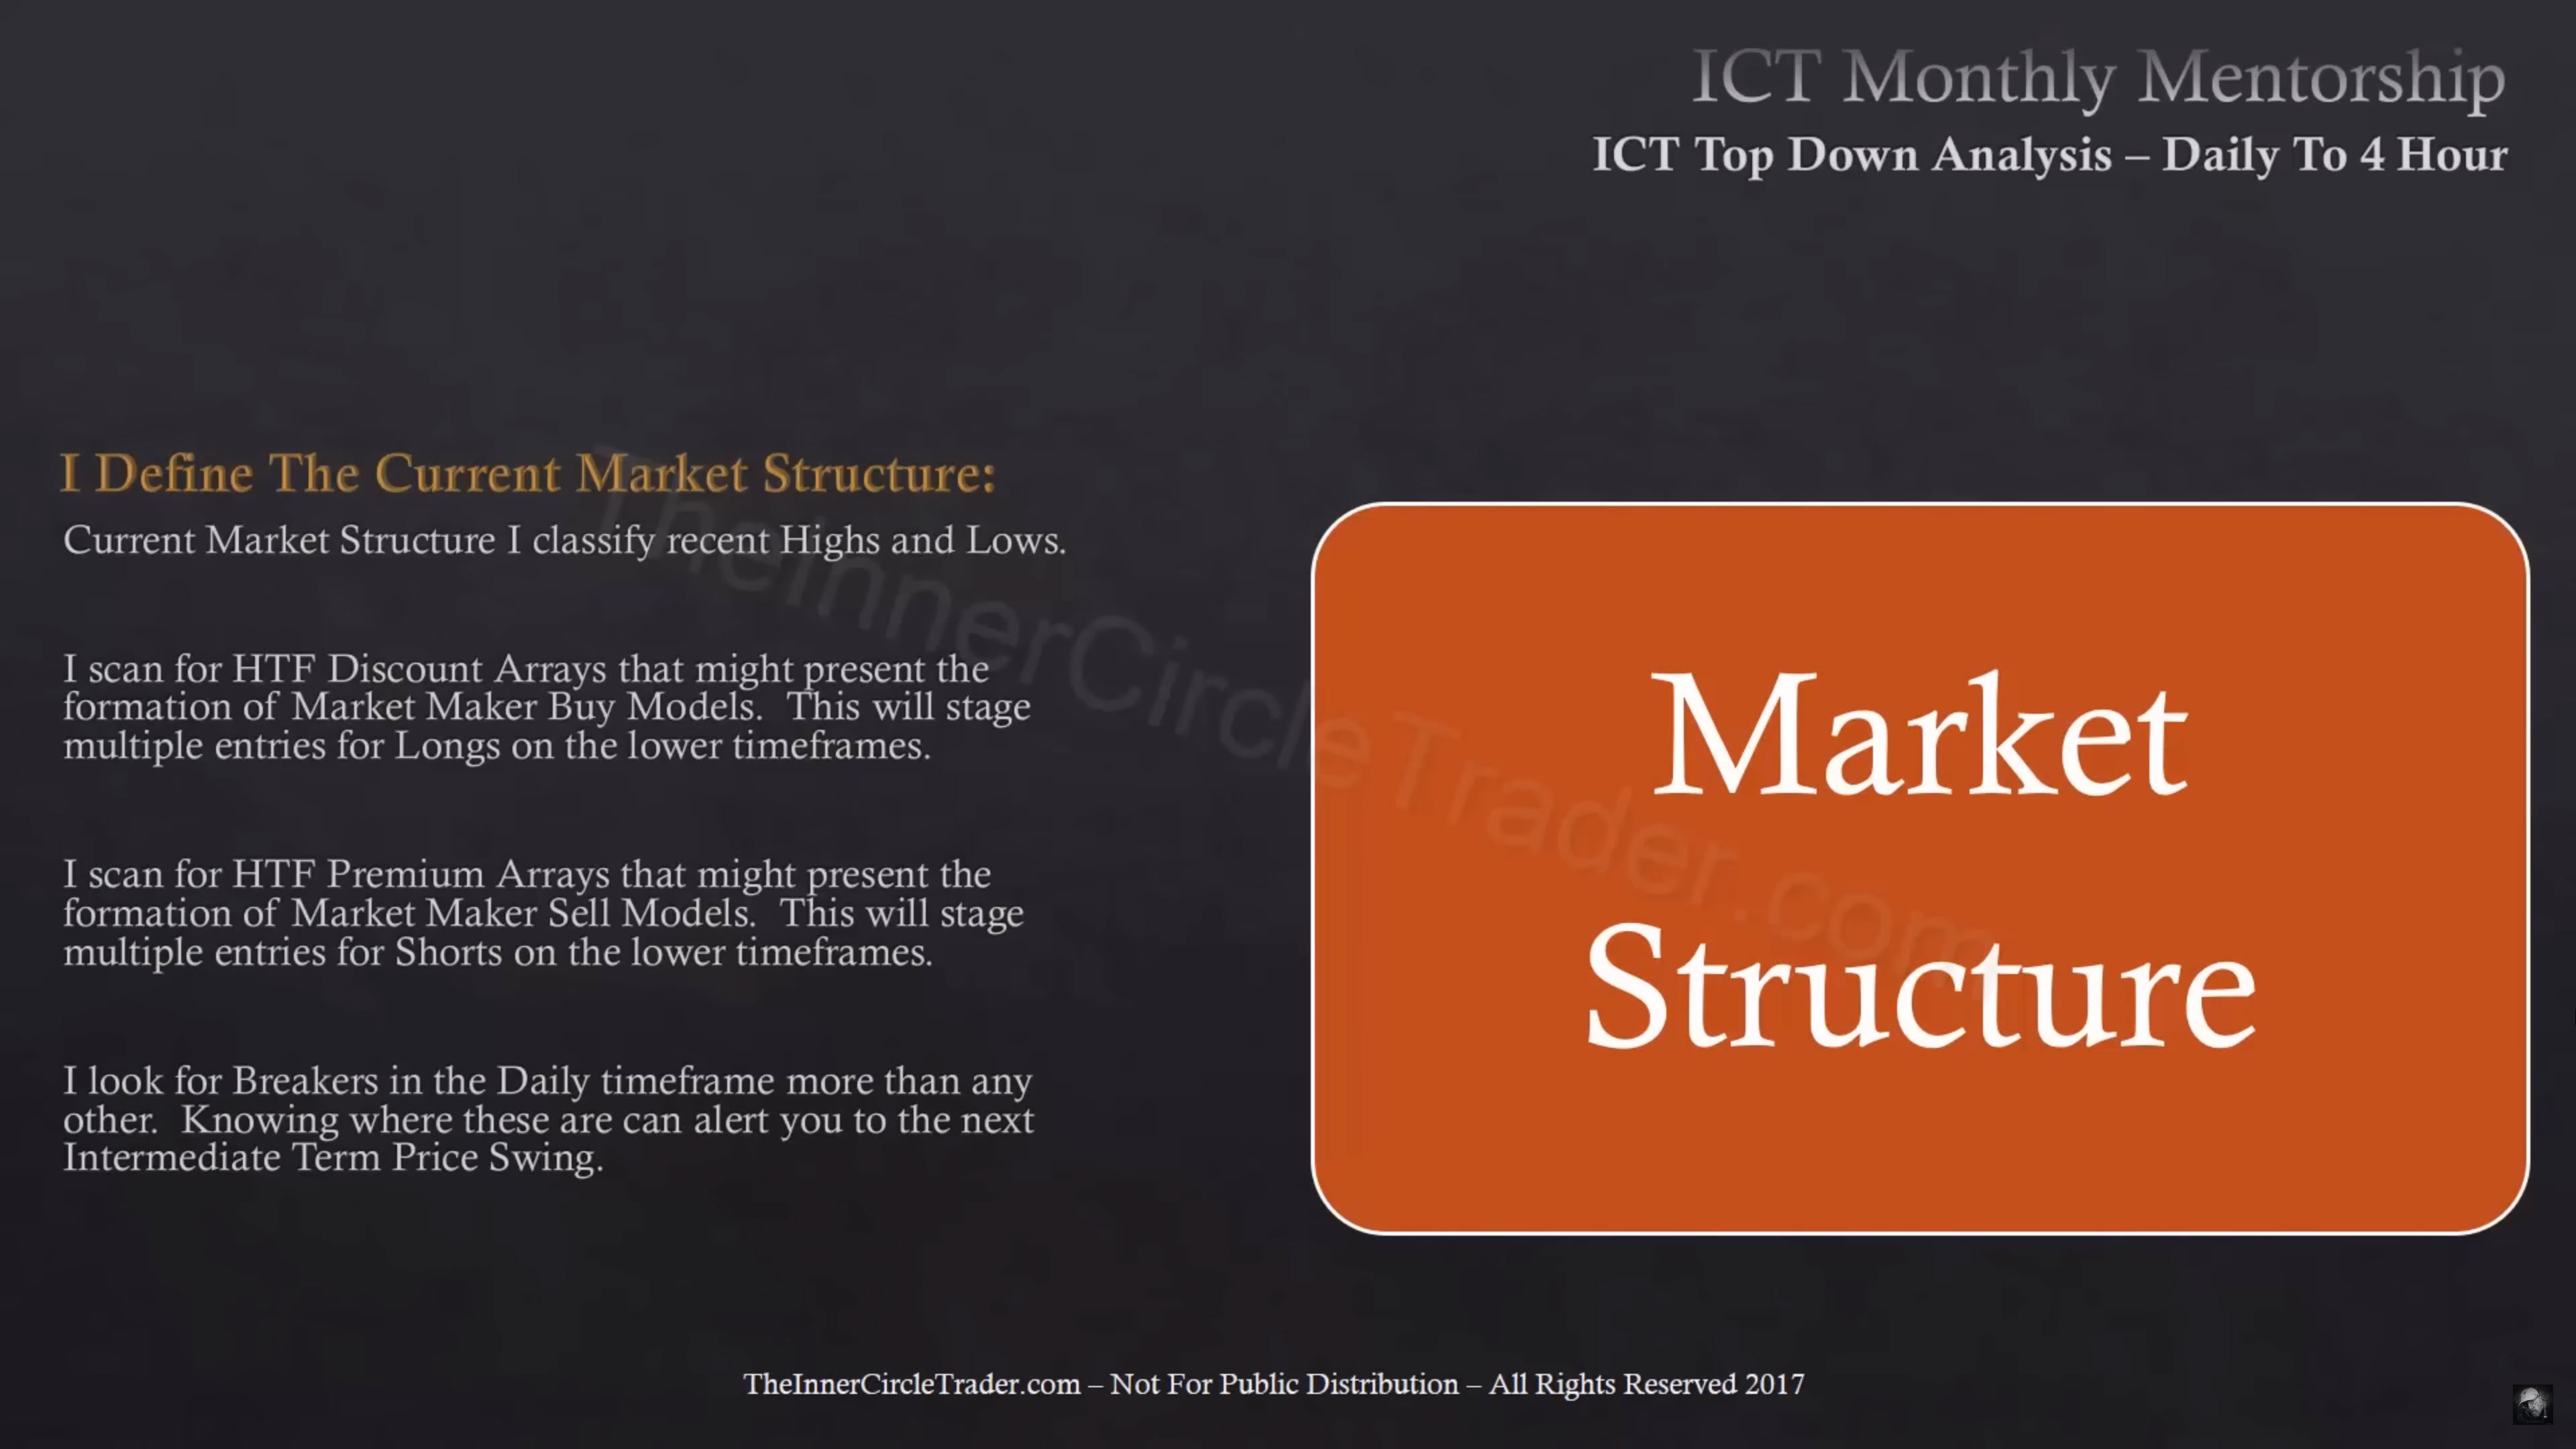
- Identifying breakers and mitigation blocks on the daily chart is important to determine where the next intermediate-term price swing may form.
- Price is constantly moving from a bullish breaker to a bearish breaker.
- If you don’t know what happens on the daily order flow, you are playing Russian roulette.
Analysis Process
- Commercial Hedging
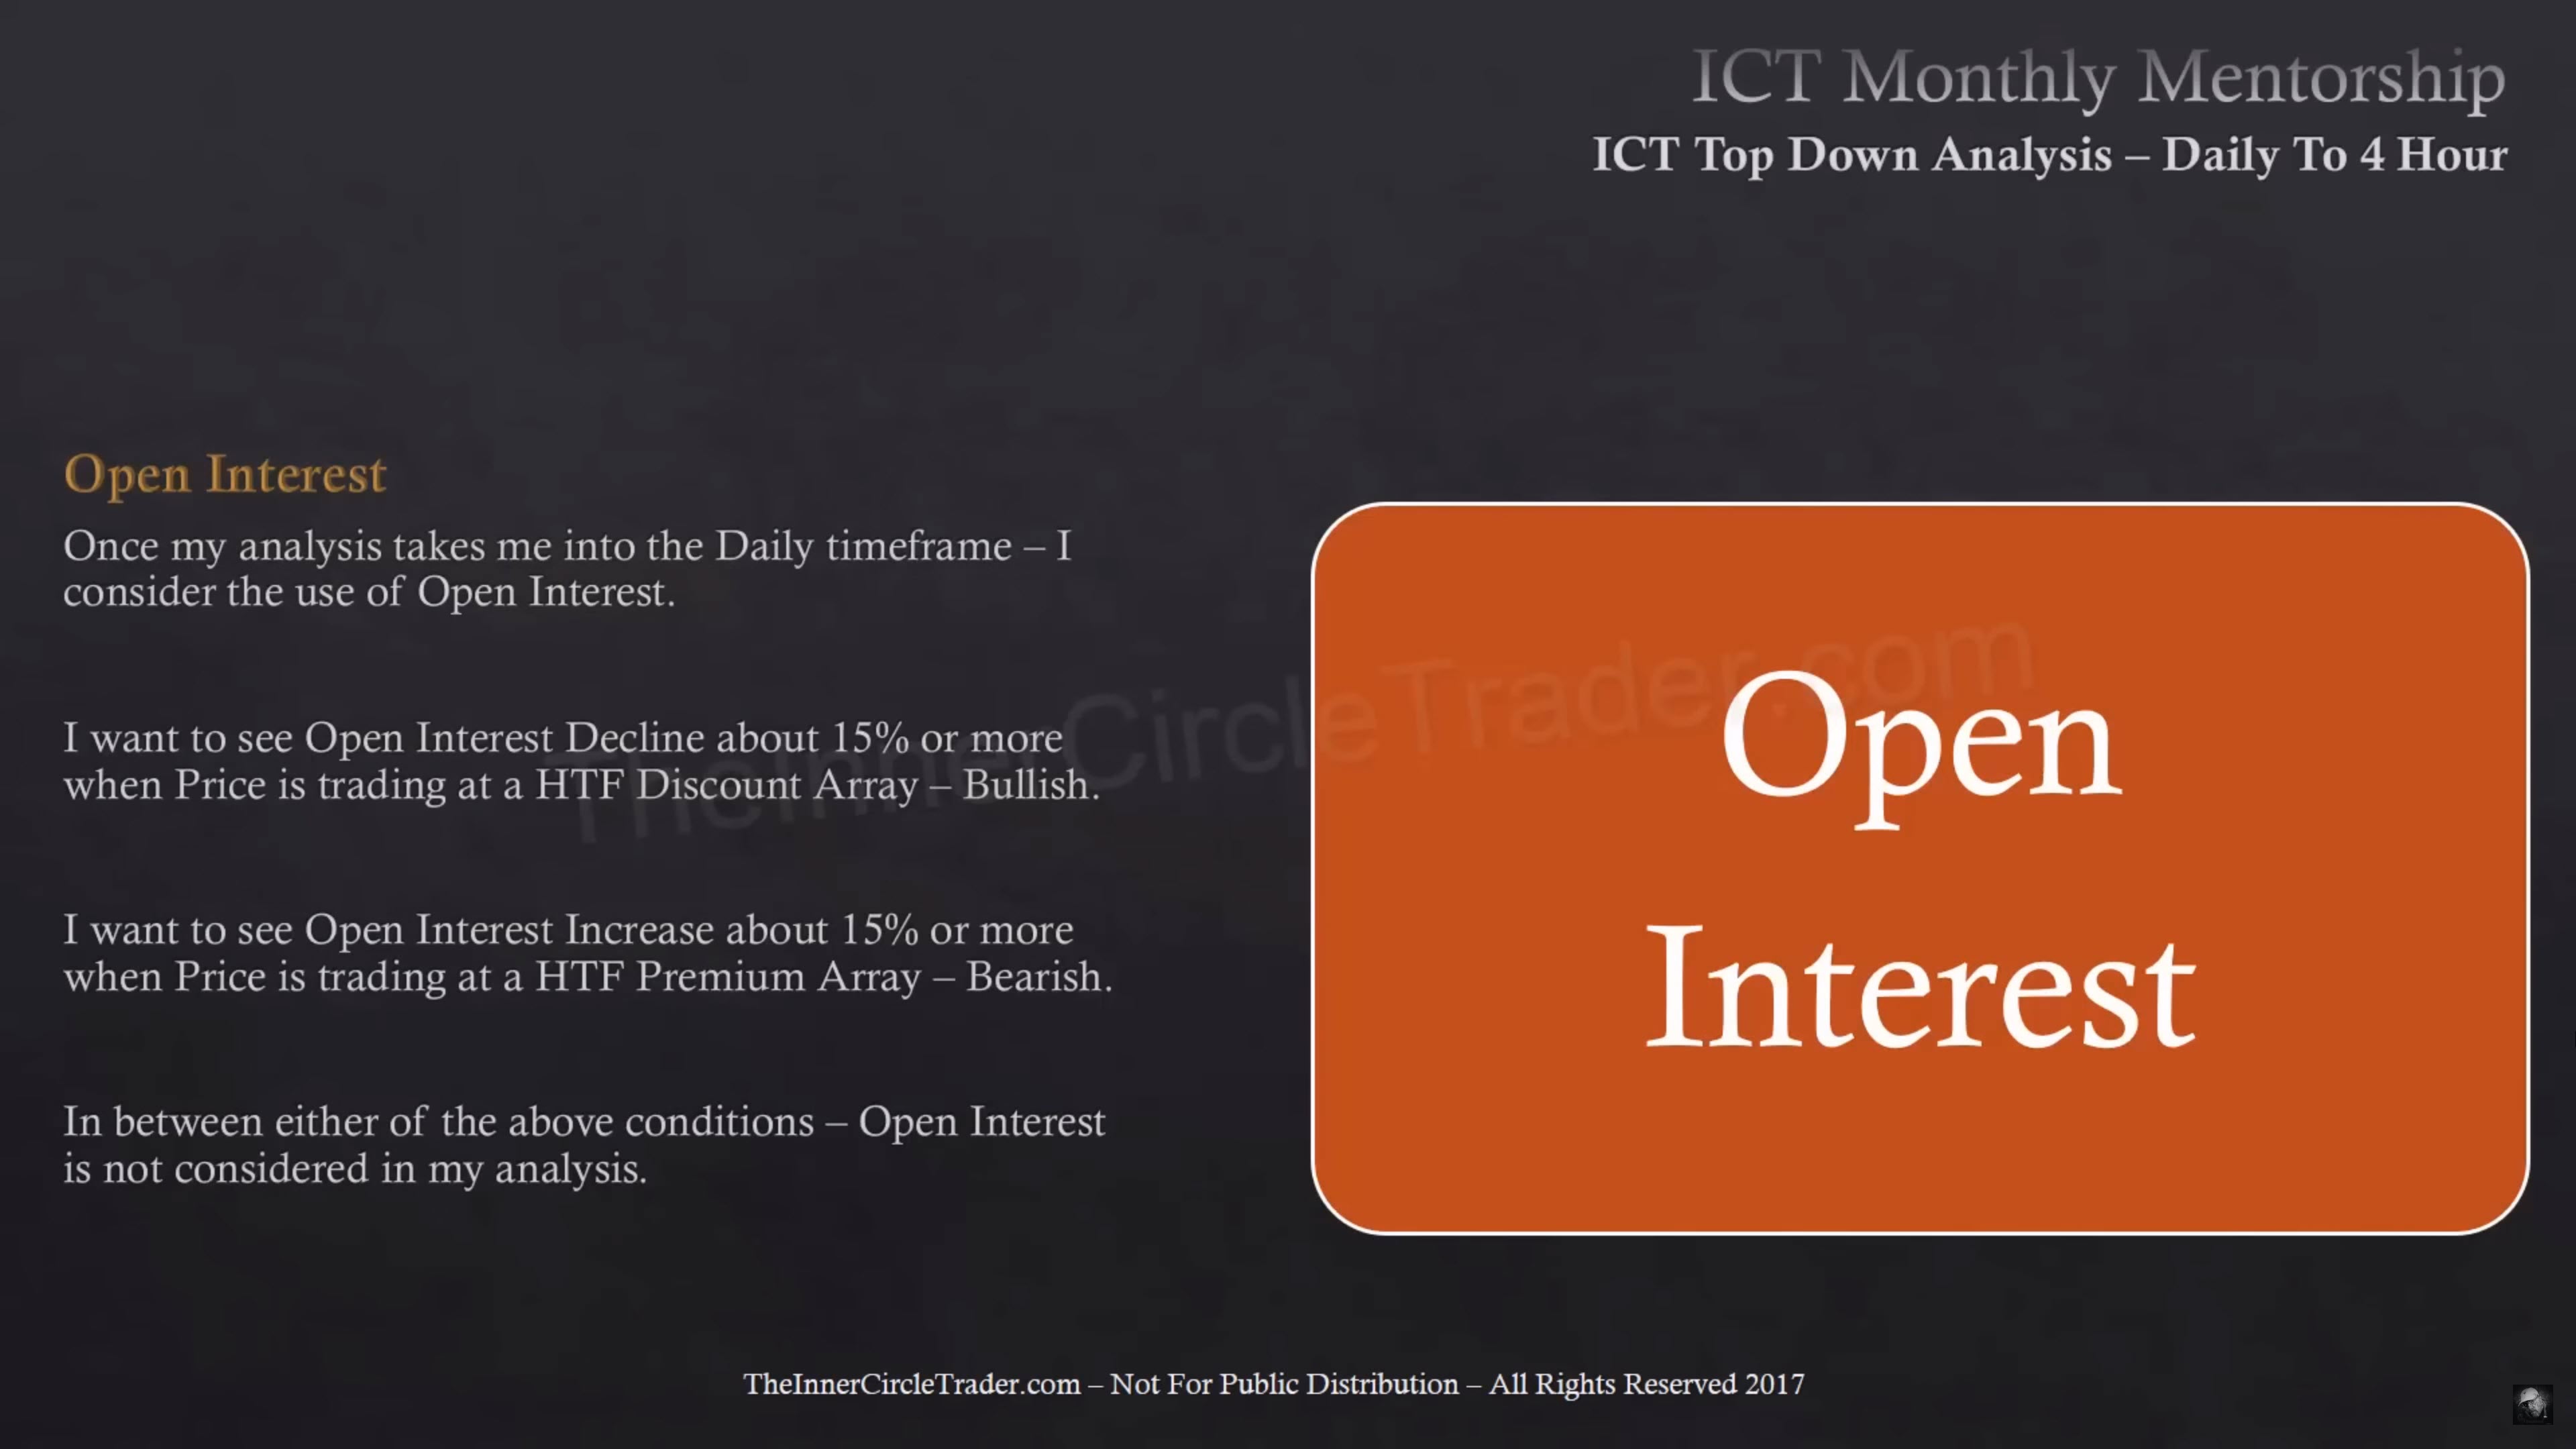
- Open Interest
- Institucional Order Flow
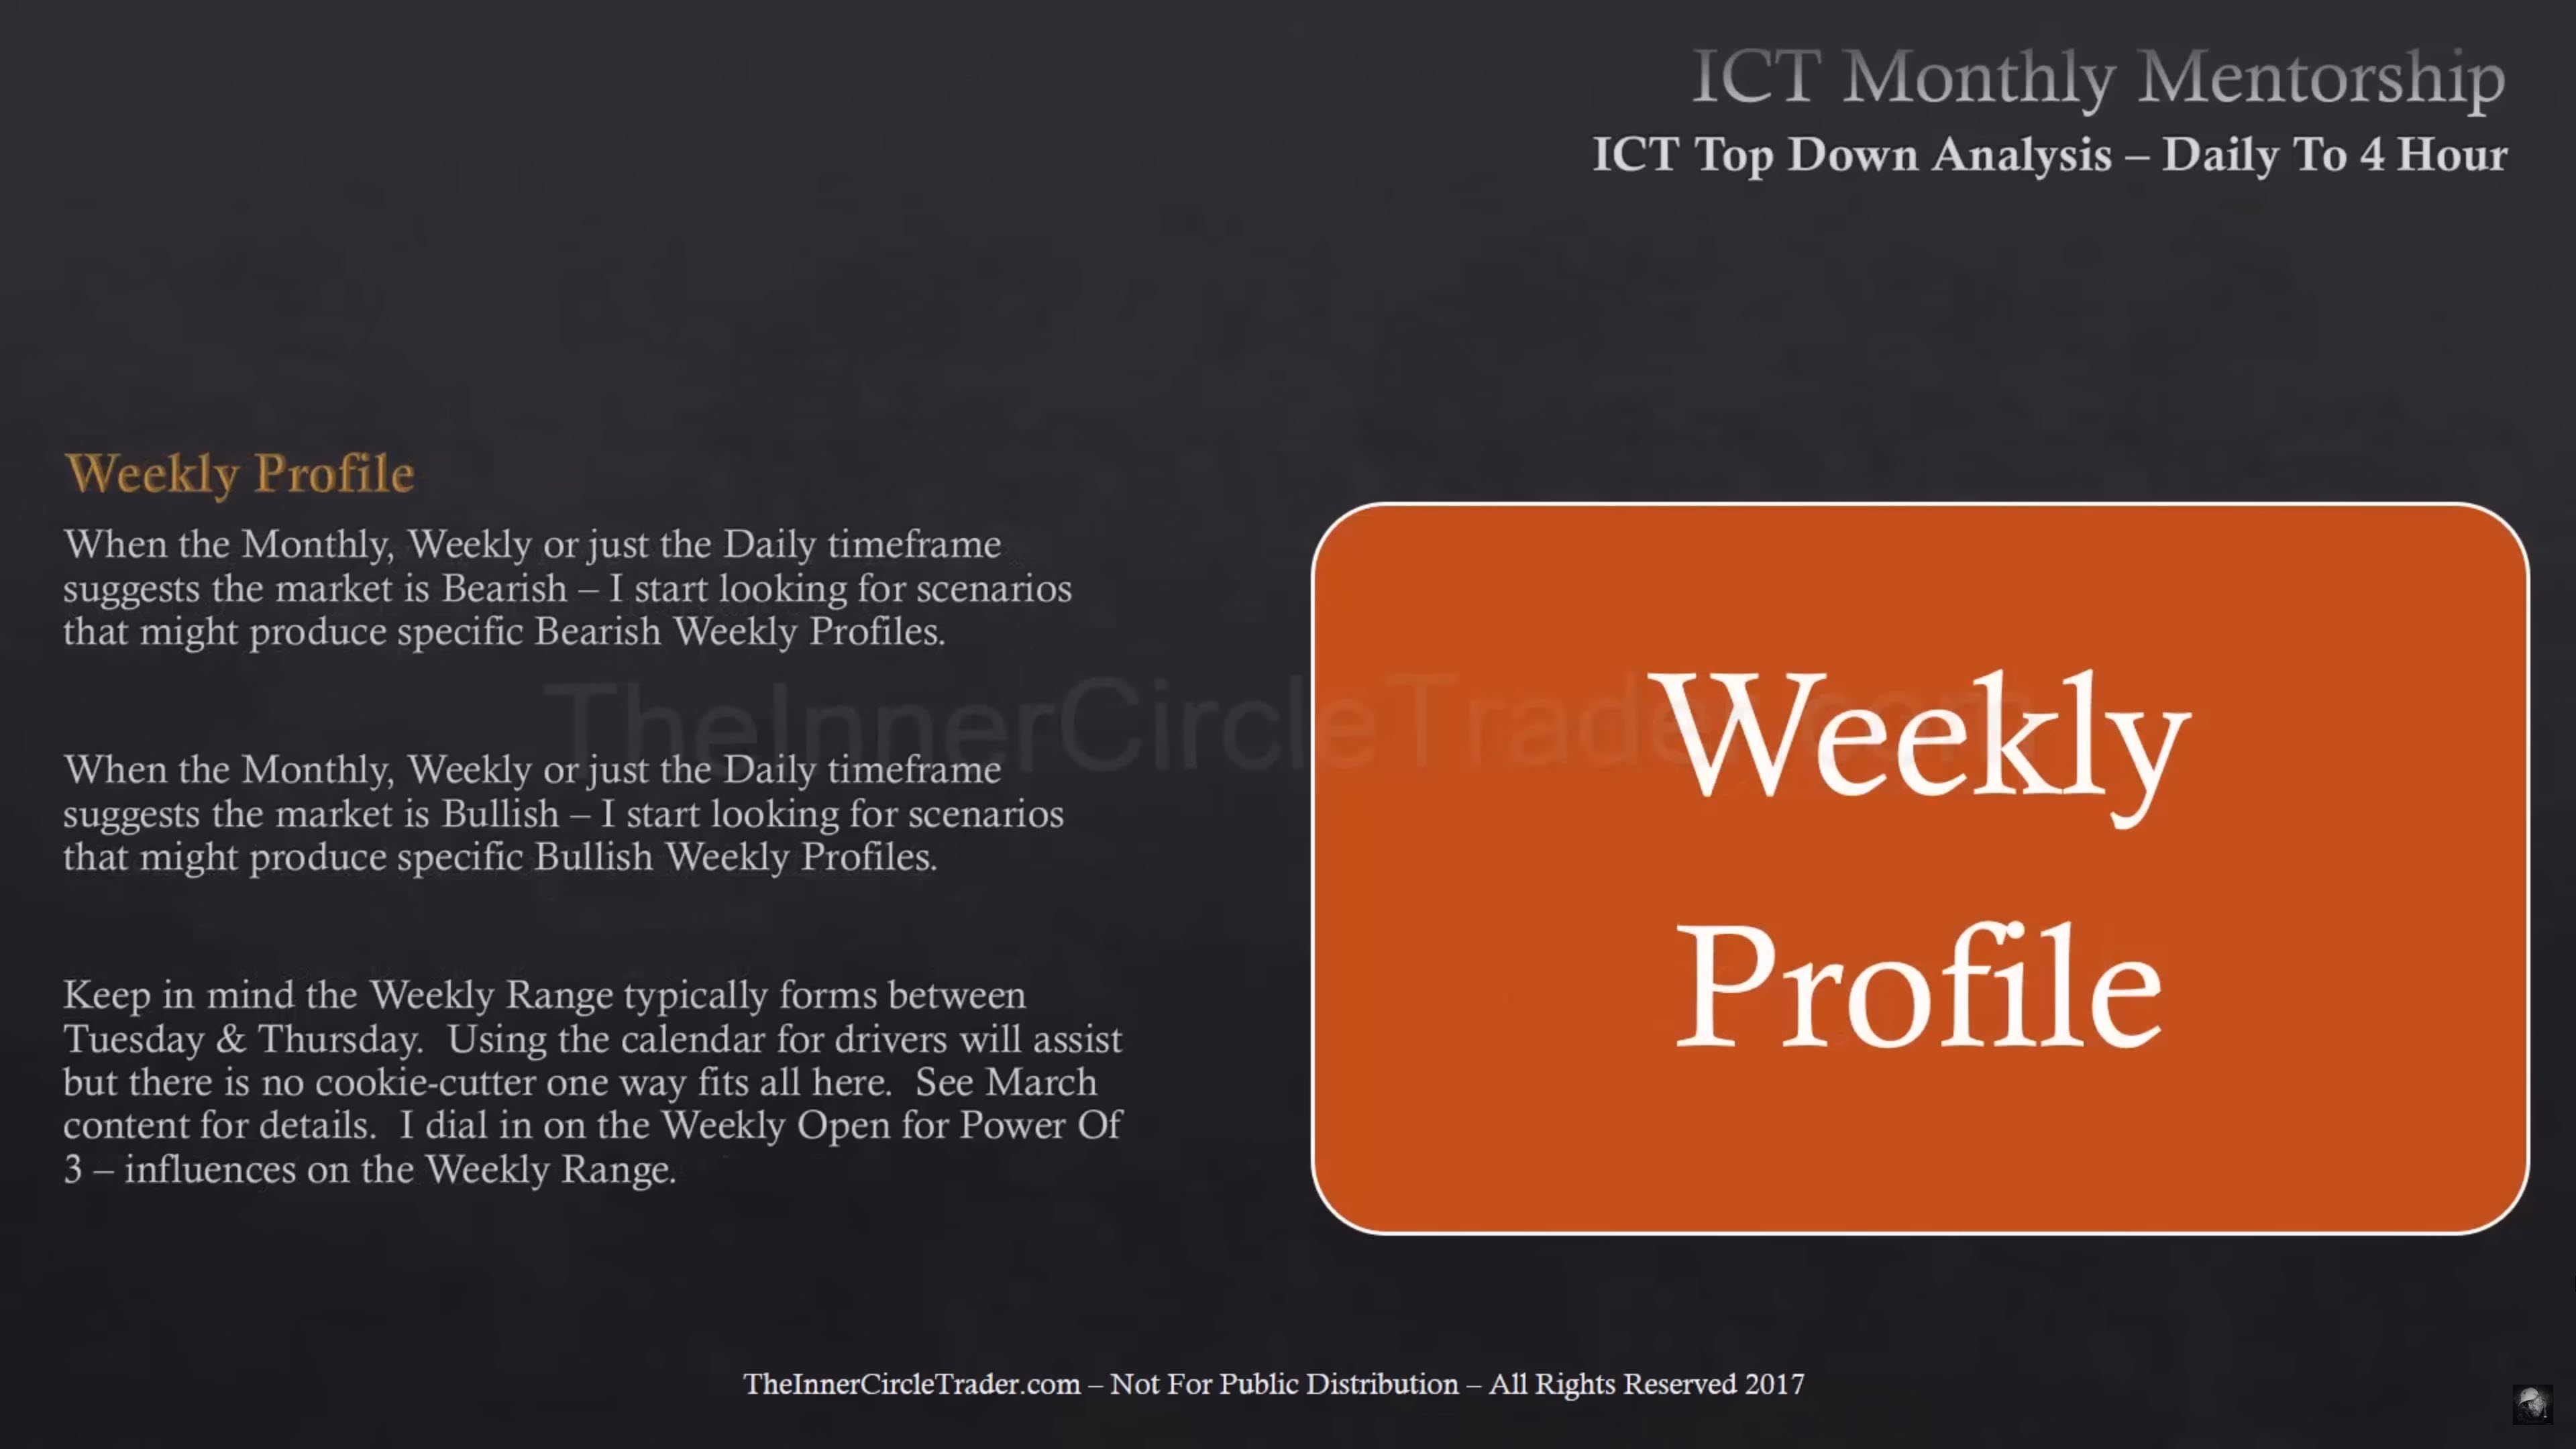
- Weekly Profile
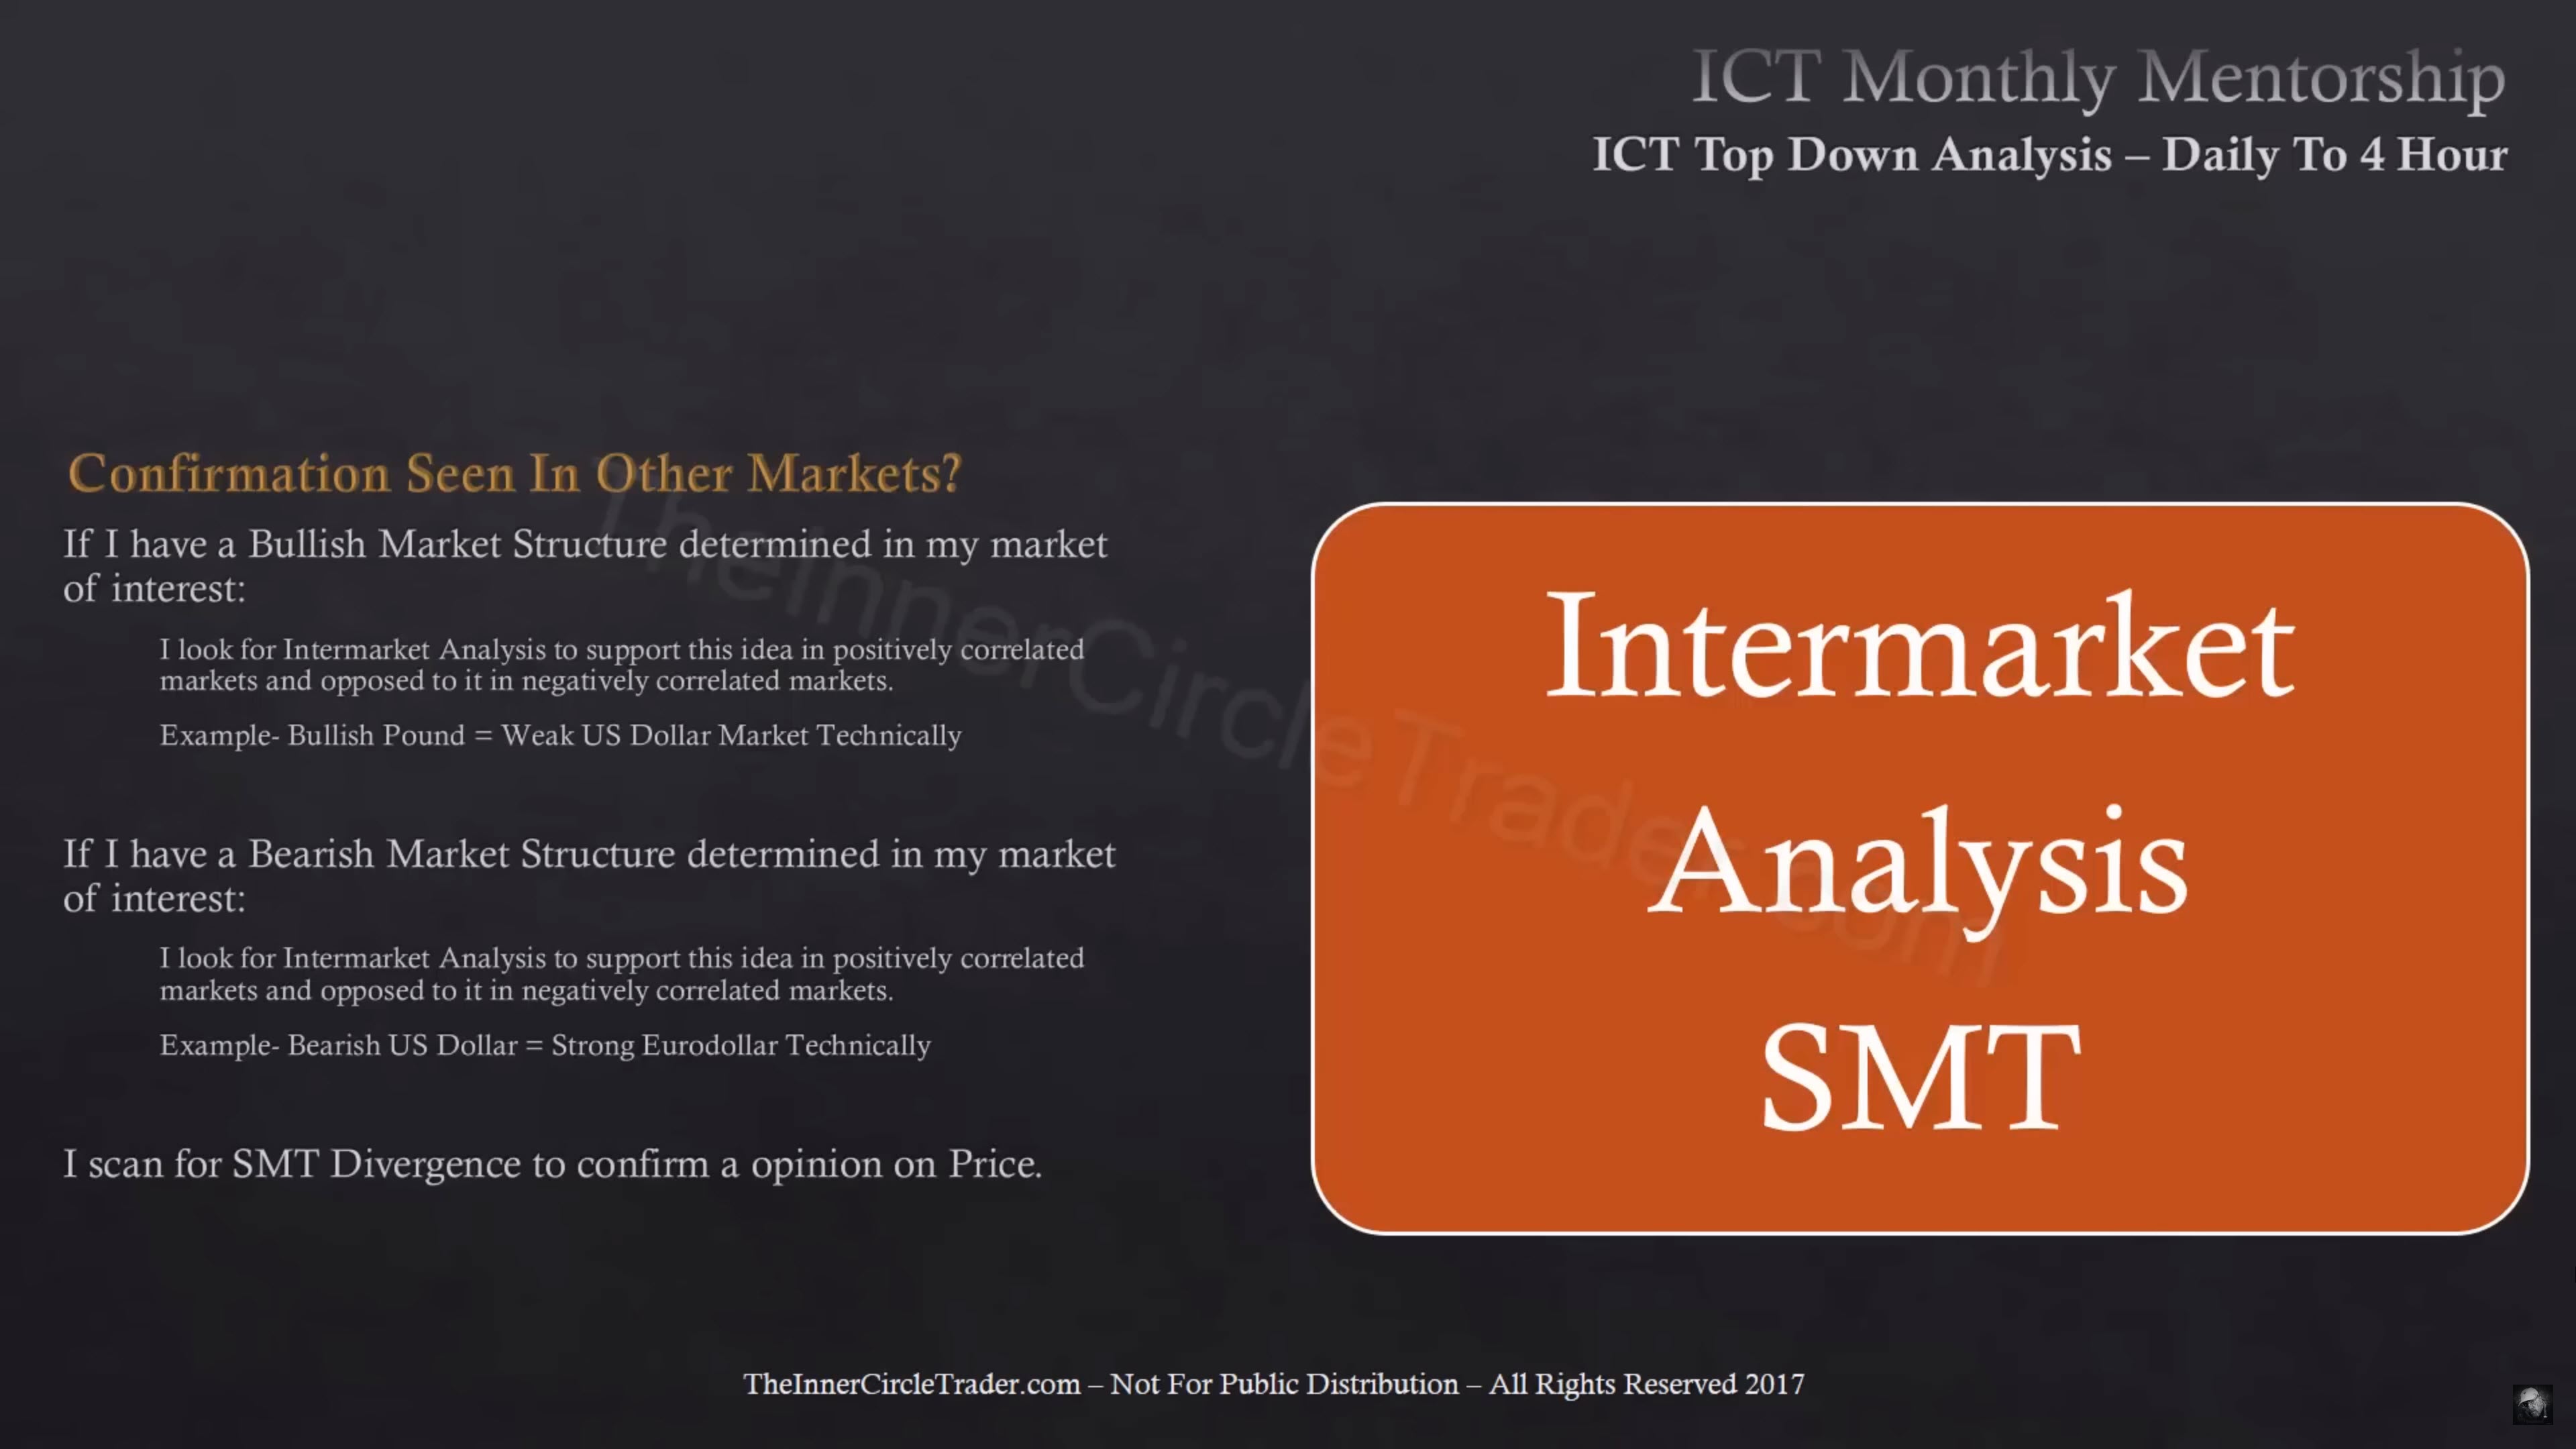
- Intermarket Analysis
- Market Structure
- PD Array Matrix
- Key Price Levels
- Daily Bias
ICT Top-Down Analysis - Commercial Hedging

ICT Top-Down Analysis - Open Interest
ICT Top-Down Analysis - Institucional Order Flow

ICT Top-Down Analysis - Weekly Profile
ICT Top-Down Analysis - Intermarket Analysis
ICT Top-Down Analysis - Market Structure
ICT Top-Down Analysis - PD Array Matrix
ICT Top-Down Analysis - Key Price Levels
ICT Top-Down Analysis - Daily Bias
Next lesson: ICT Mentorship Core Content - Month 12 - Intraday Top-Down Analysis
Previous lesson: ICT Mentorship Core Content - Month 12 - Intermediate Term Top-Down Analysis