
Notes
- In this lesson, Michael introduces a swing model that combines moving averages with the Optimal Trade Entry technique.
- This swing model is applicable to all markets and all asset classes.
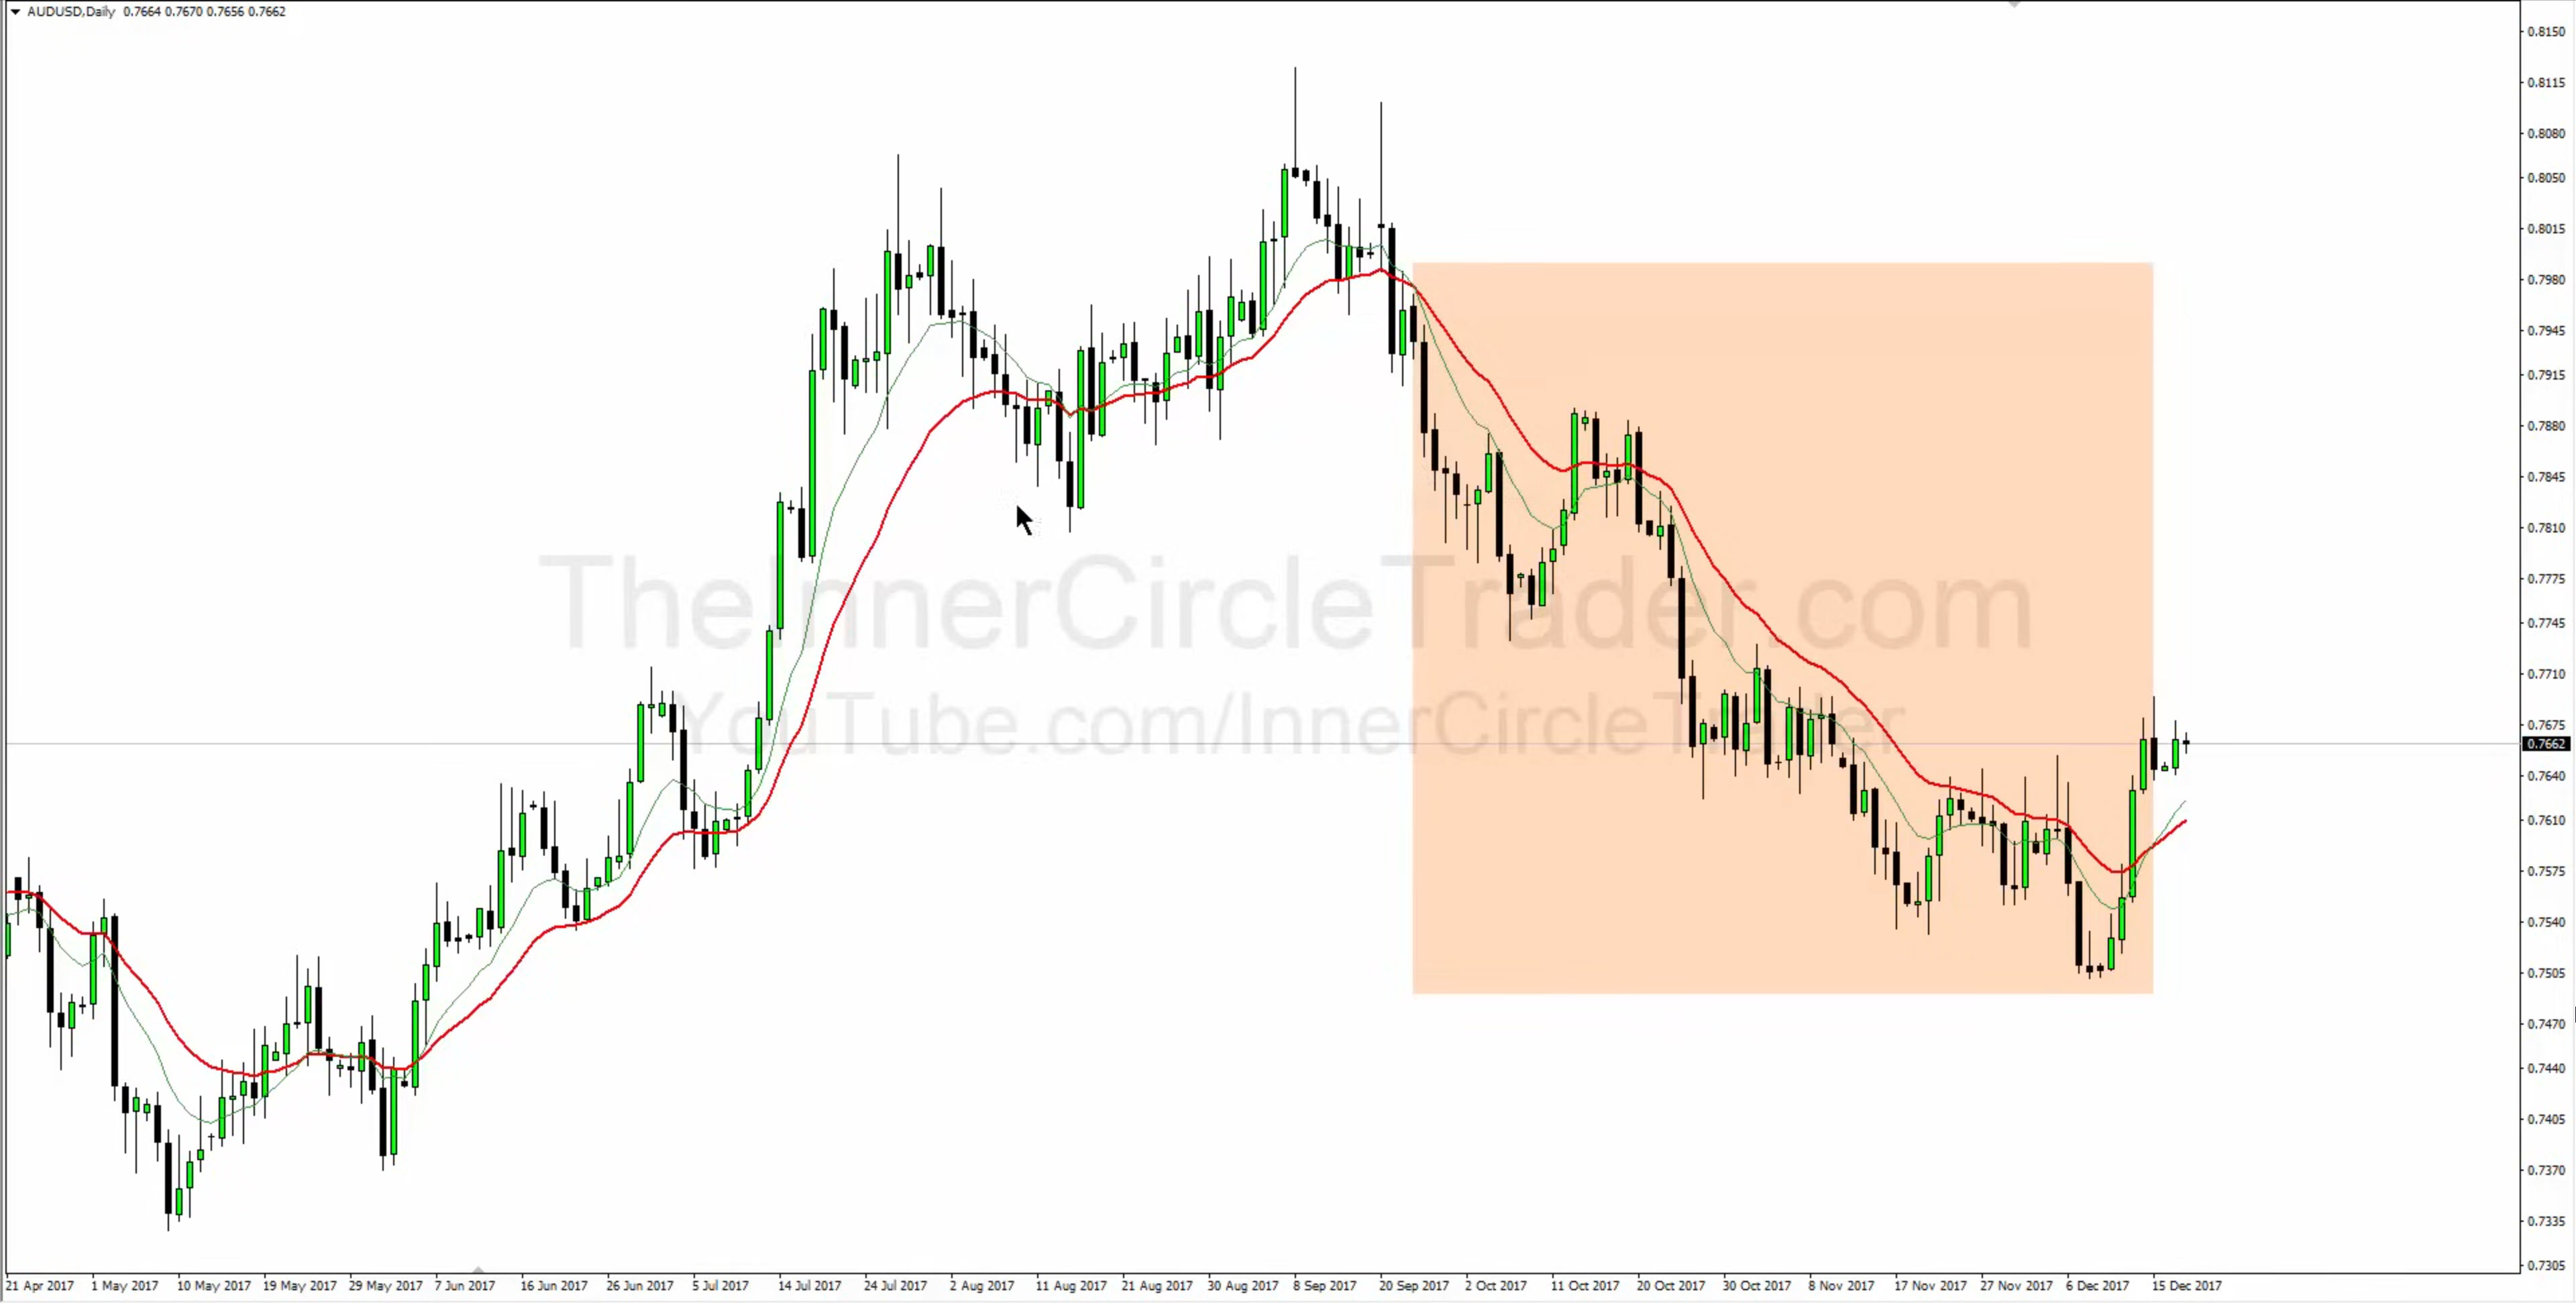
- To determine the trend, the model uses 10-period and 20-period exponential moving averages calculated on closing prices. We use them on daily and hourly charts.
- We are in bullish conditions if the market leaves the consolidation by breaking the swing high and the moving average with a period of 10 gets above the moving average with a period of 20 (bullish crossover).
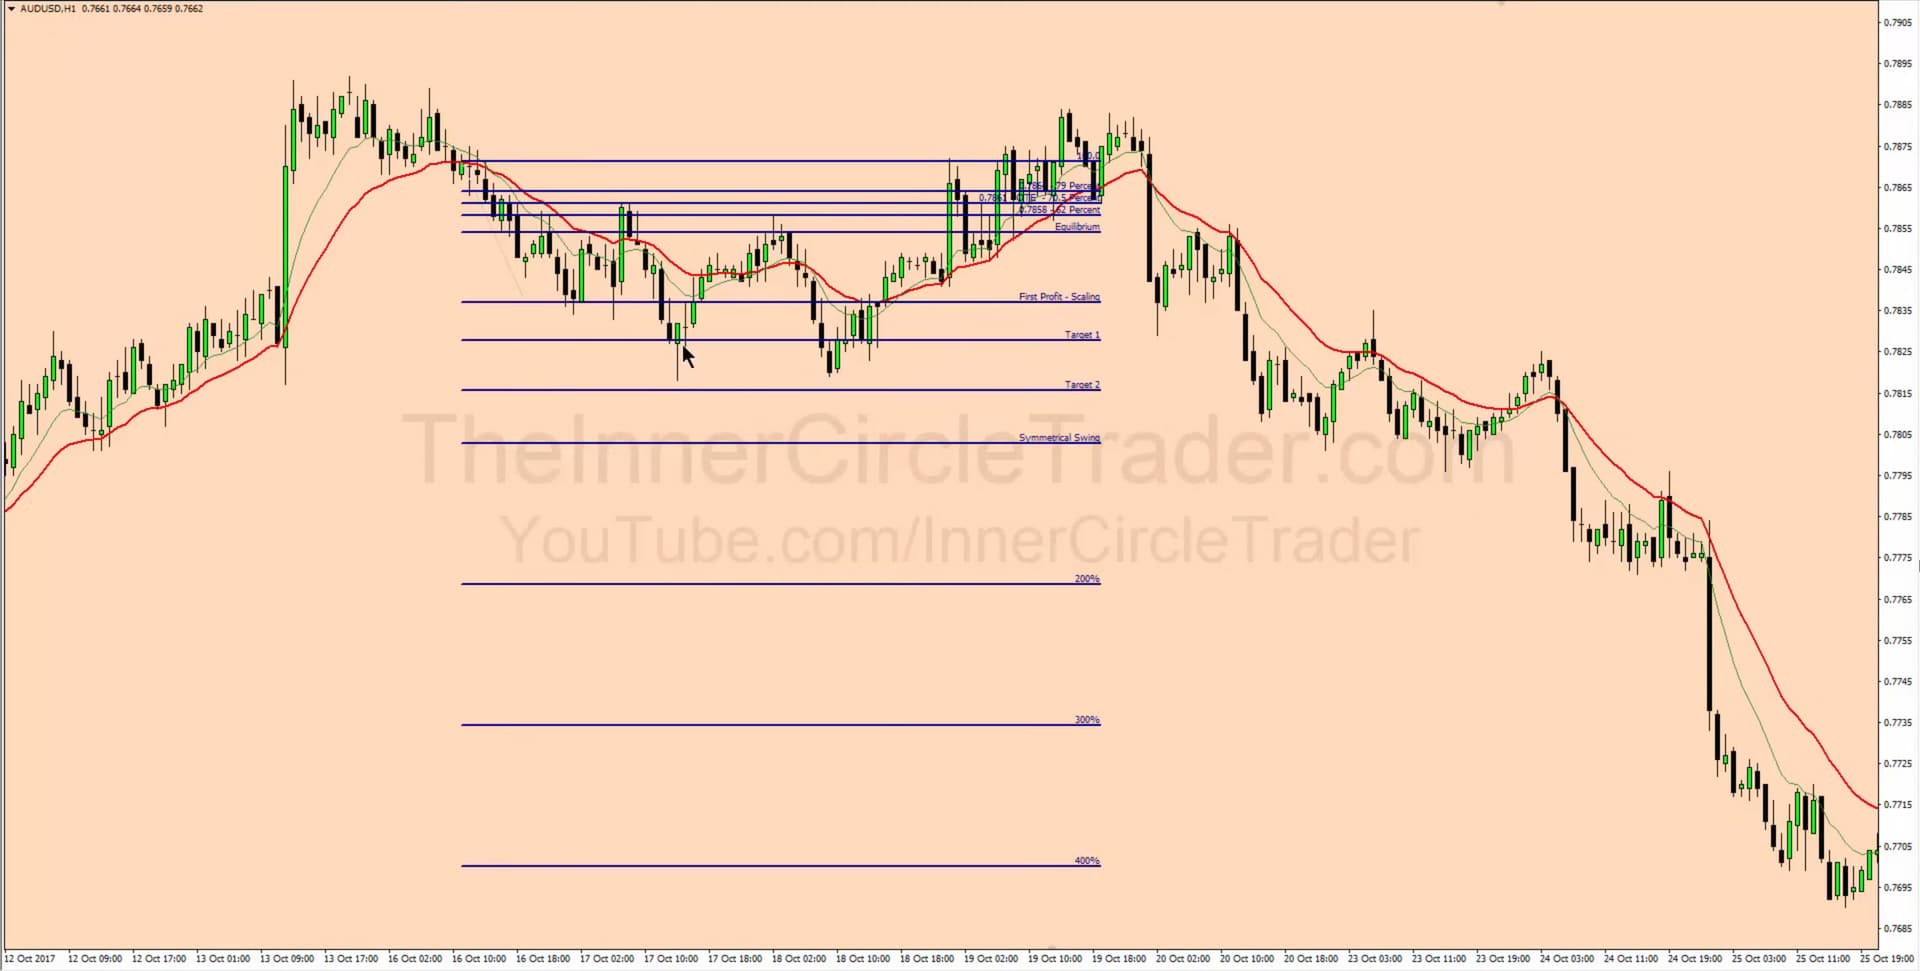
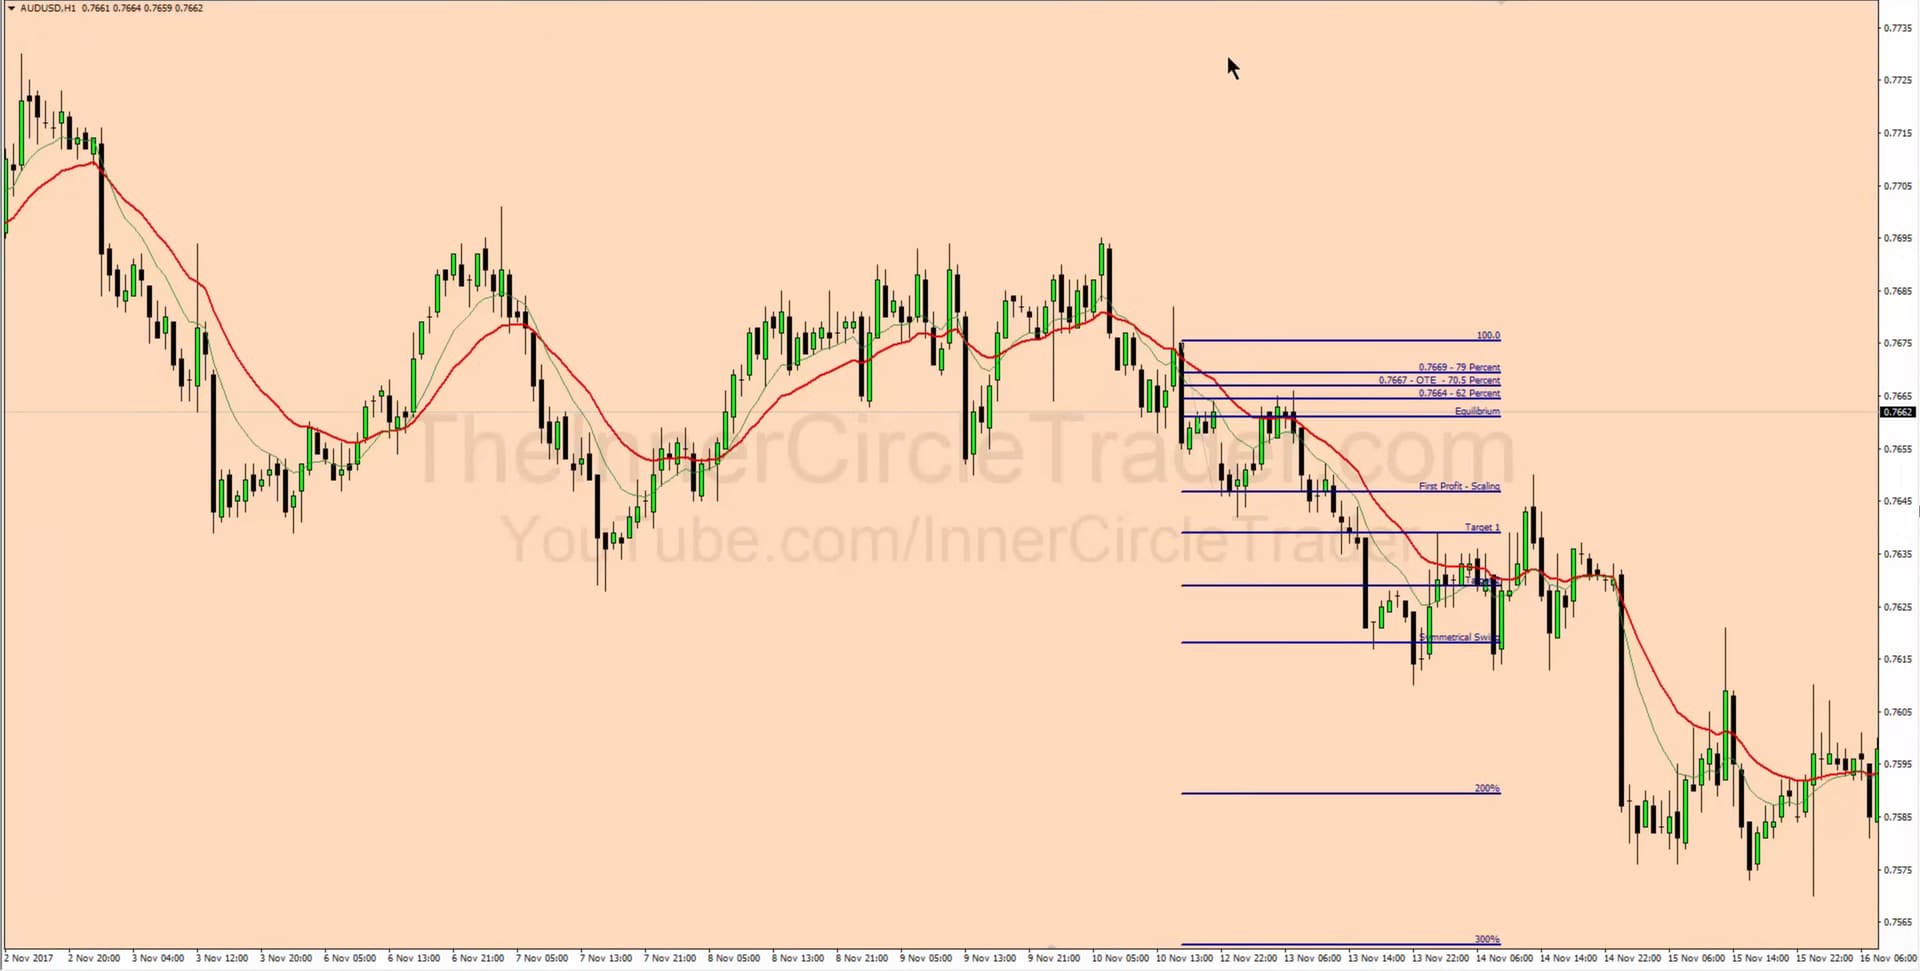
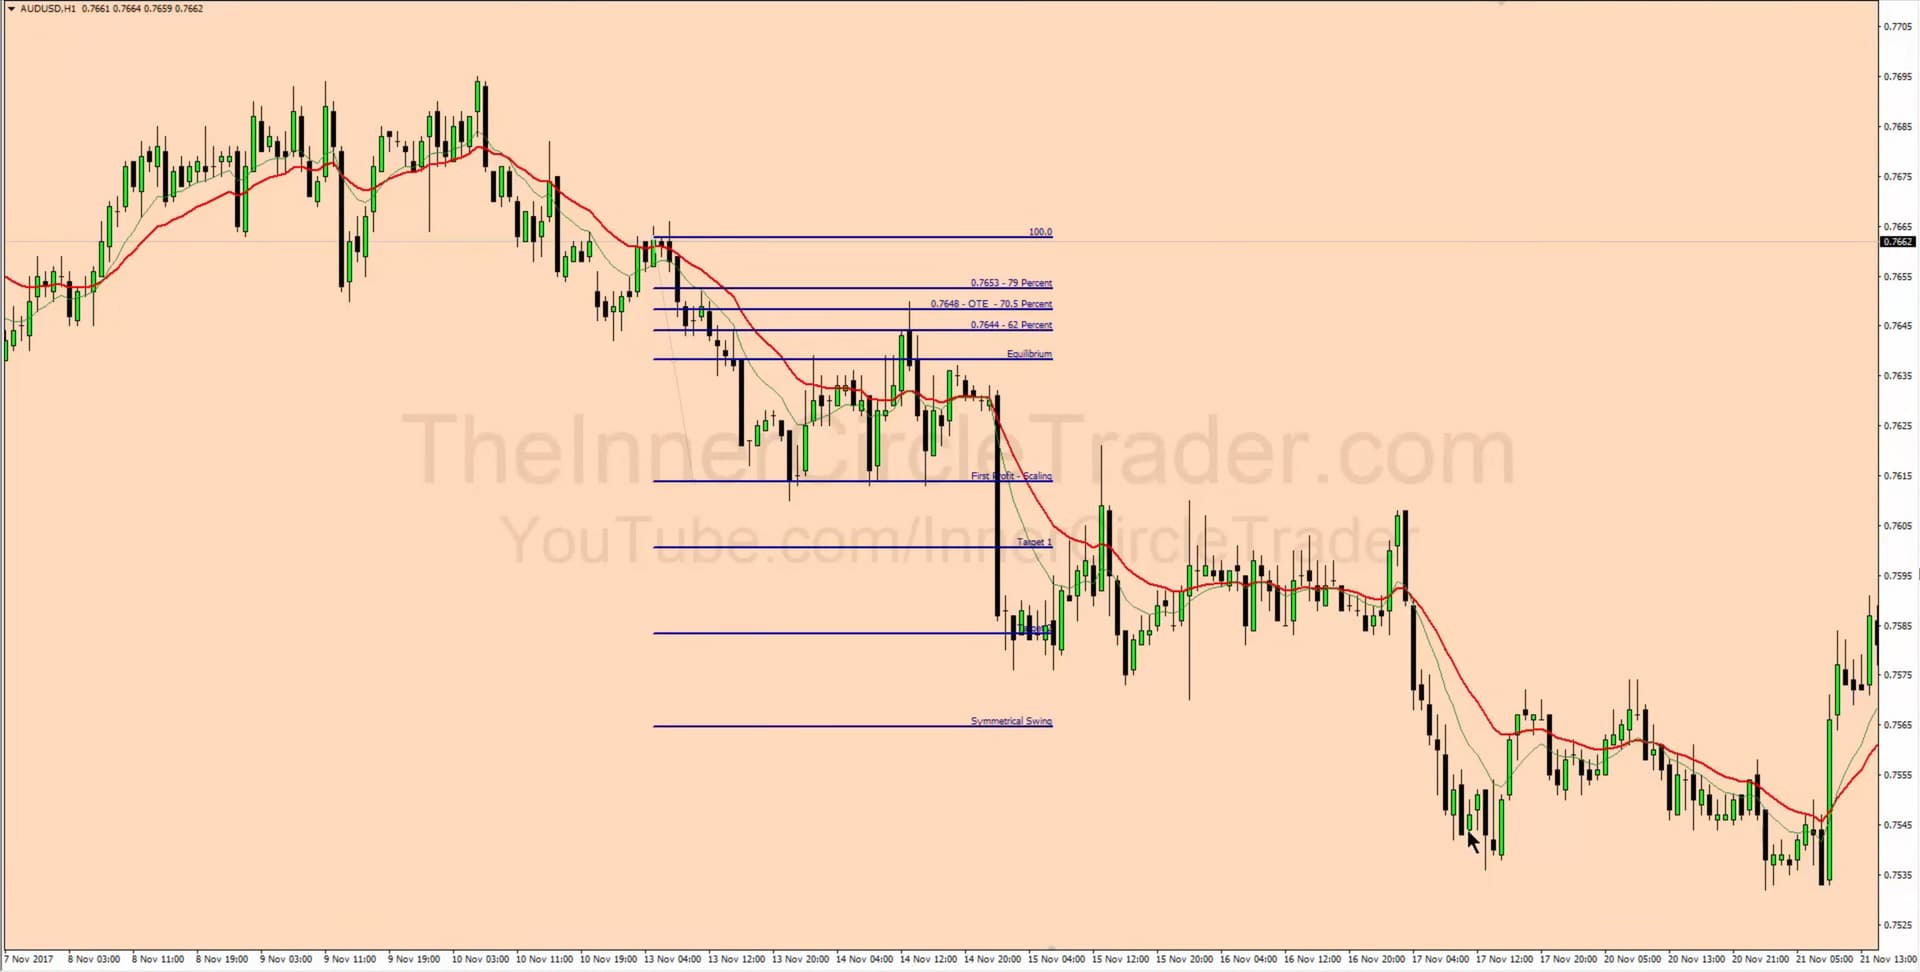
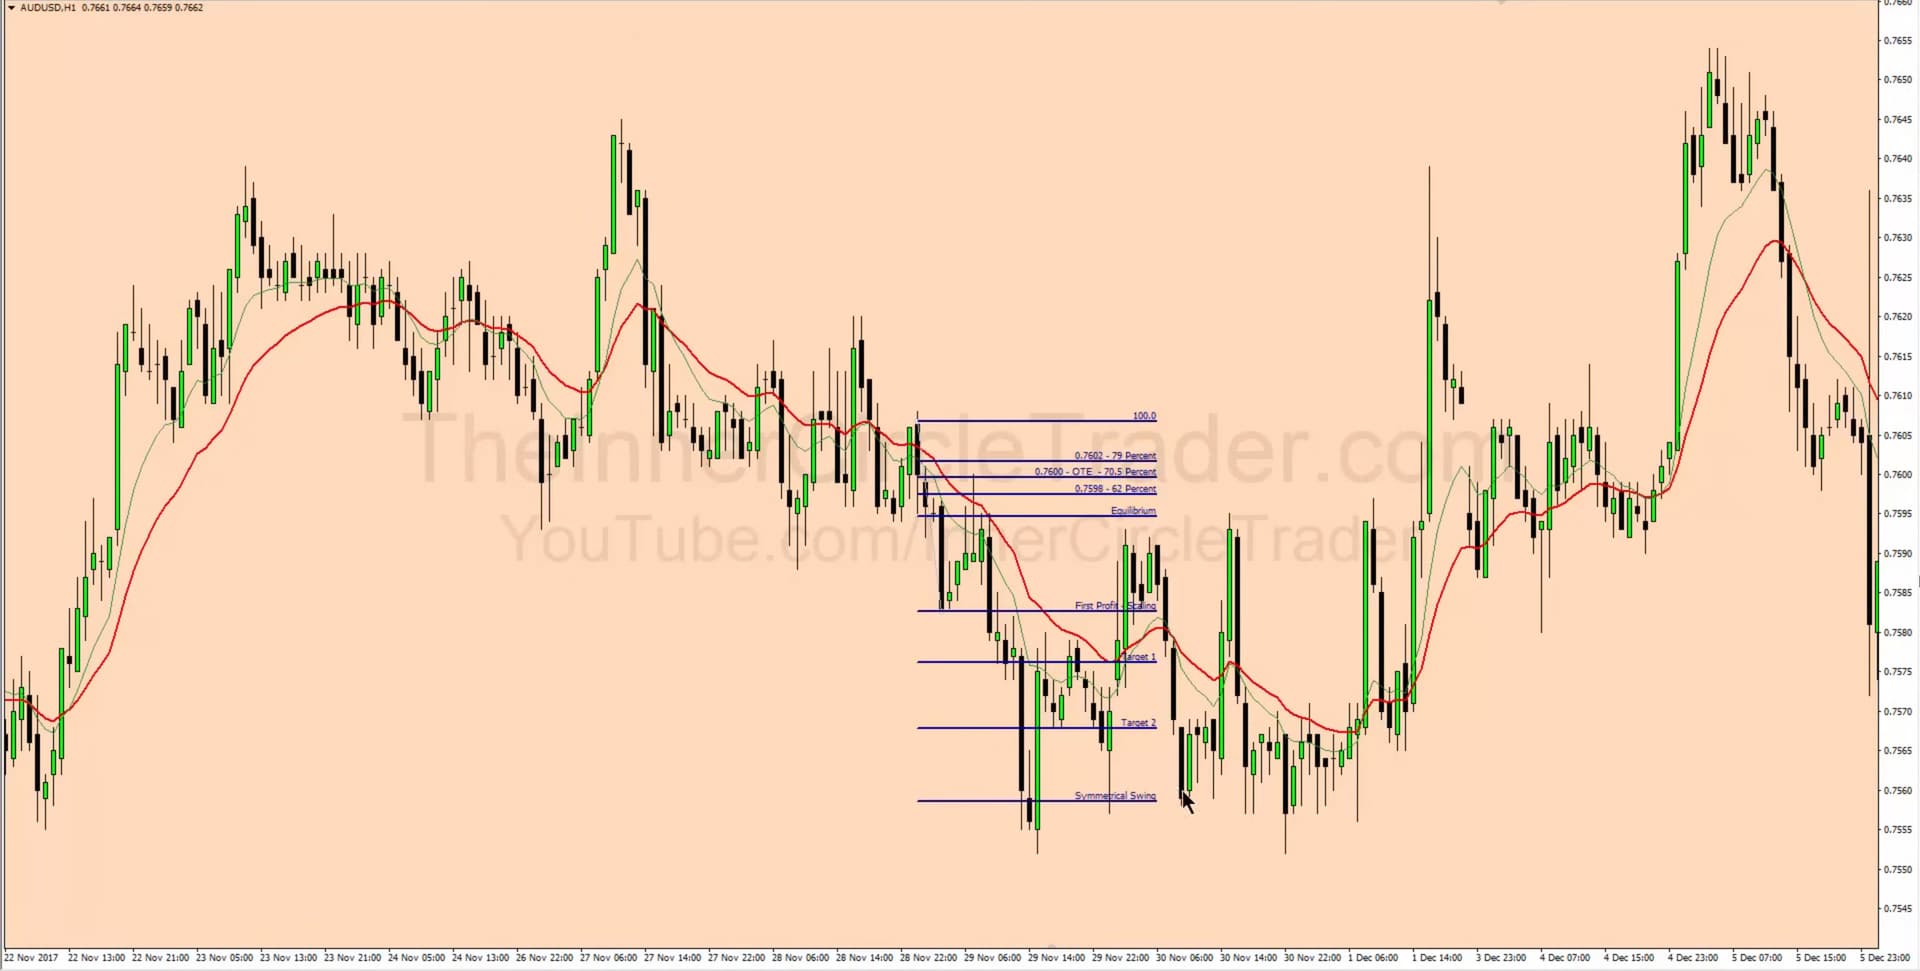
- We are in bearish conditions if the market leaves the consolidation by breaking the swing low and the moving average with a period of 10 gets below the moving average with a period of 20 (bearish crossover).
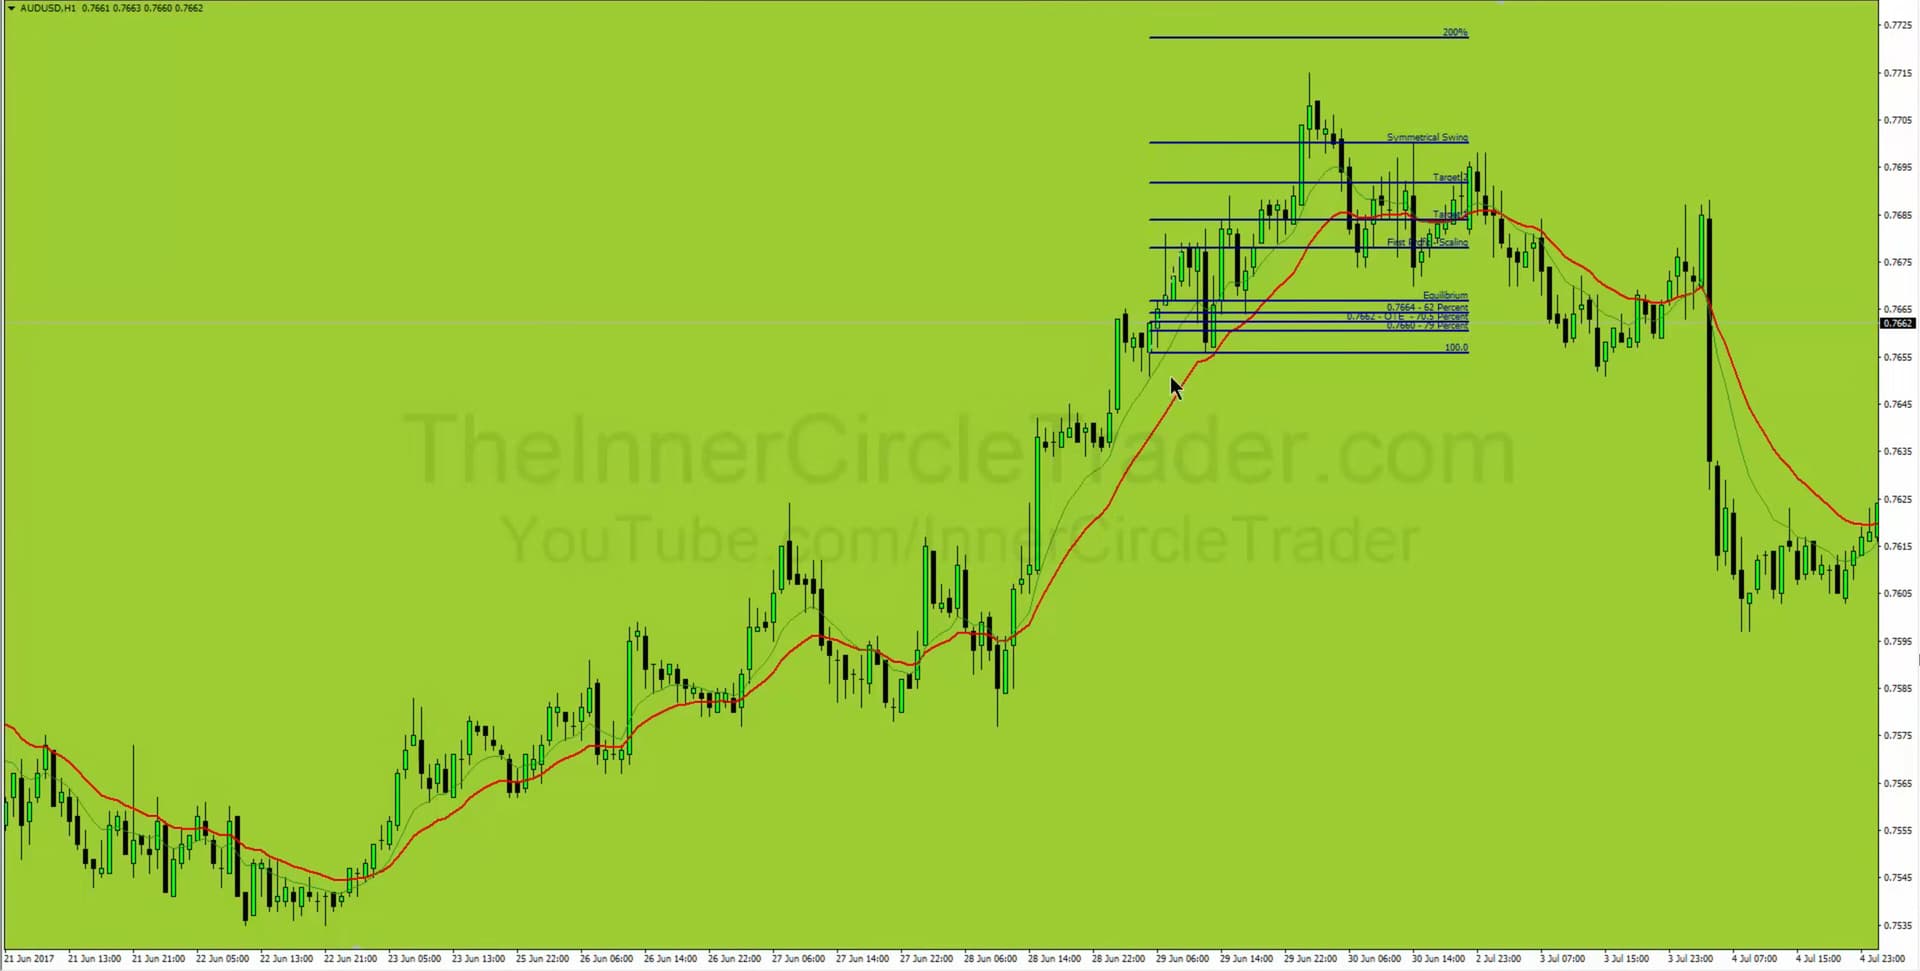
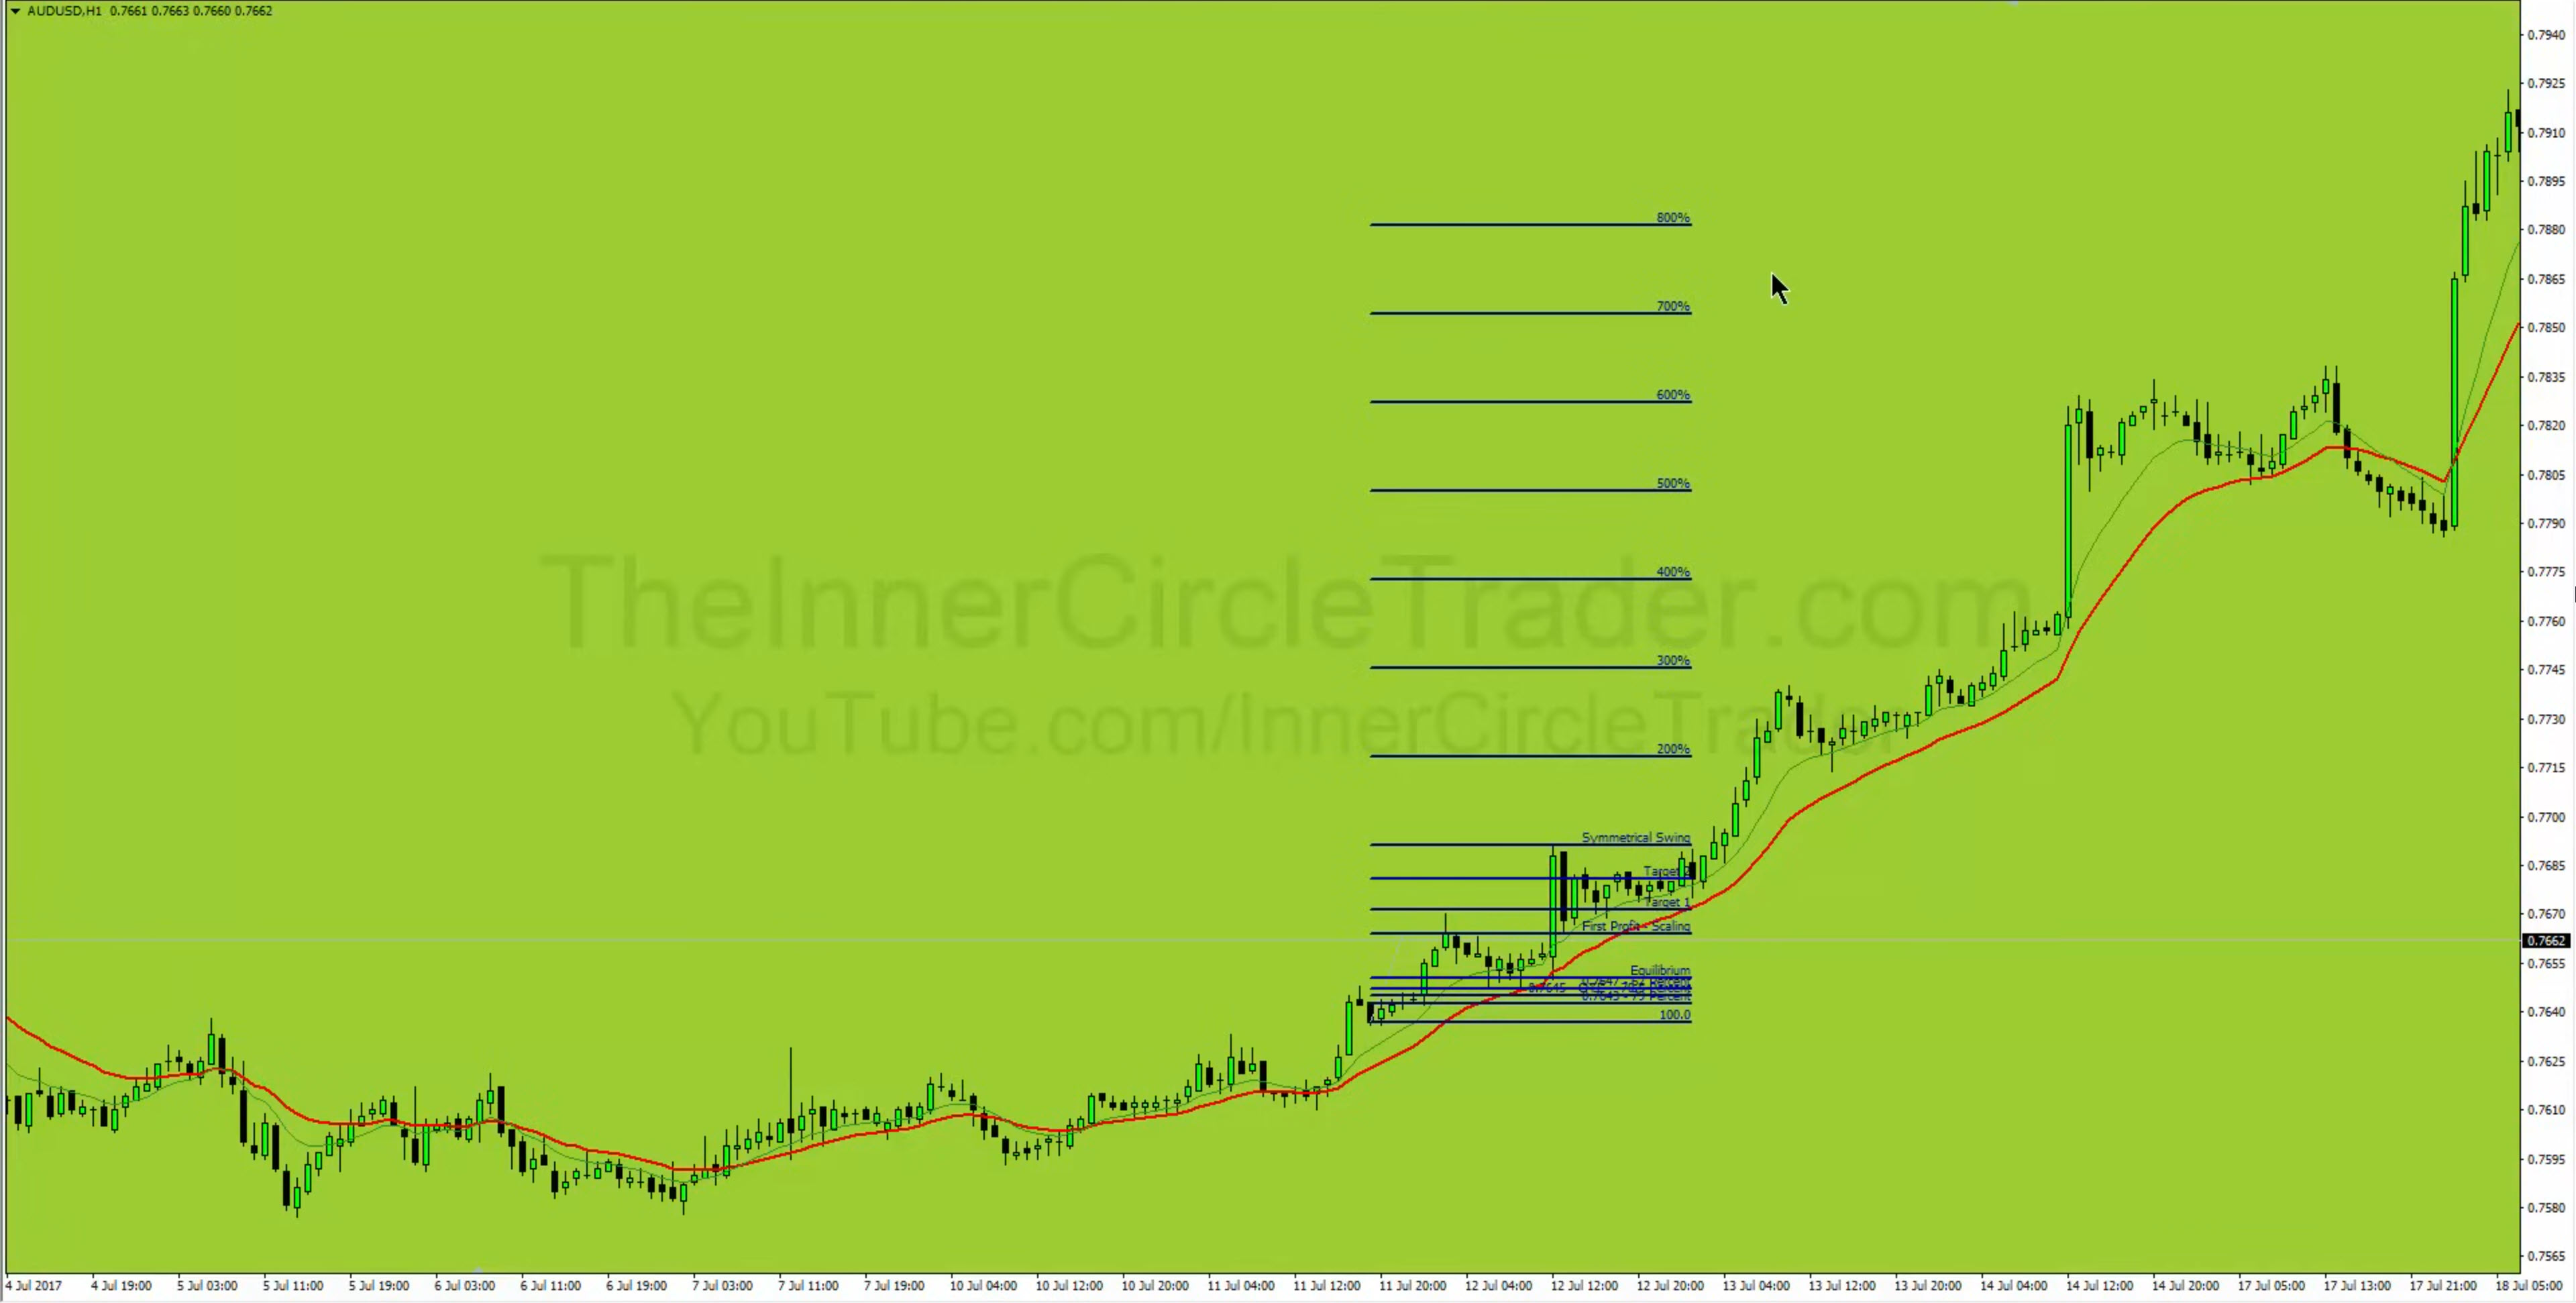
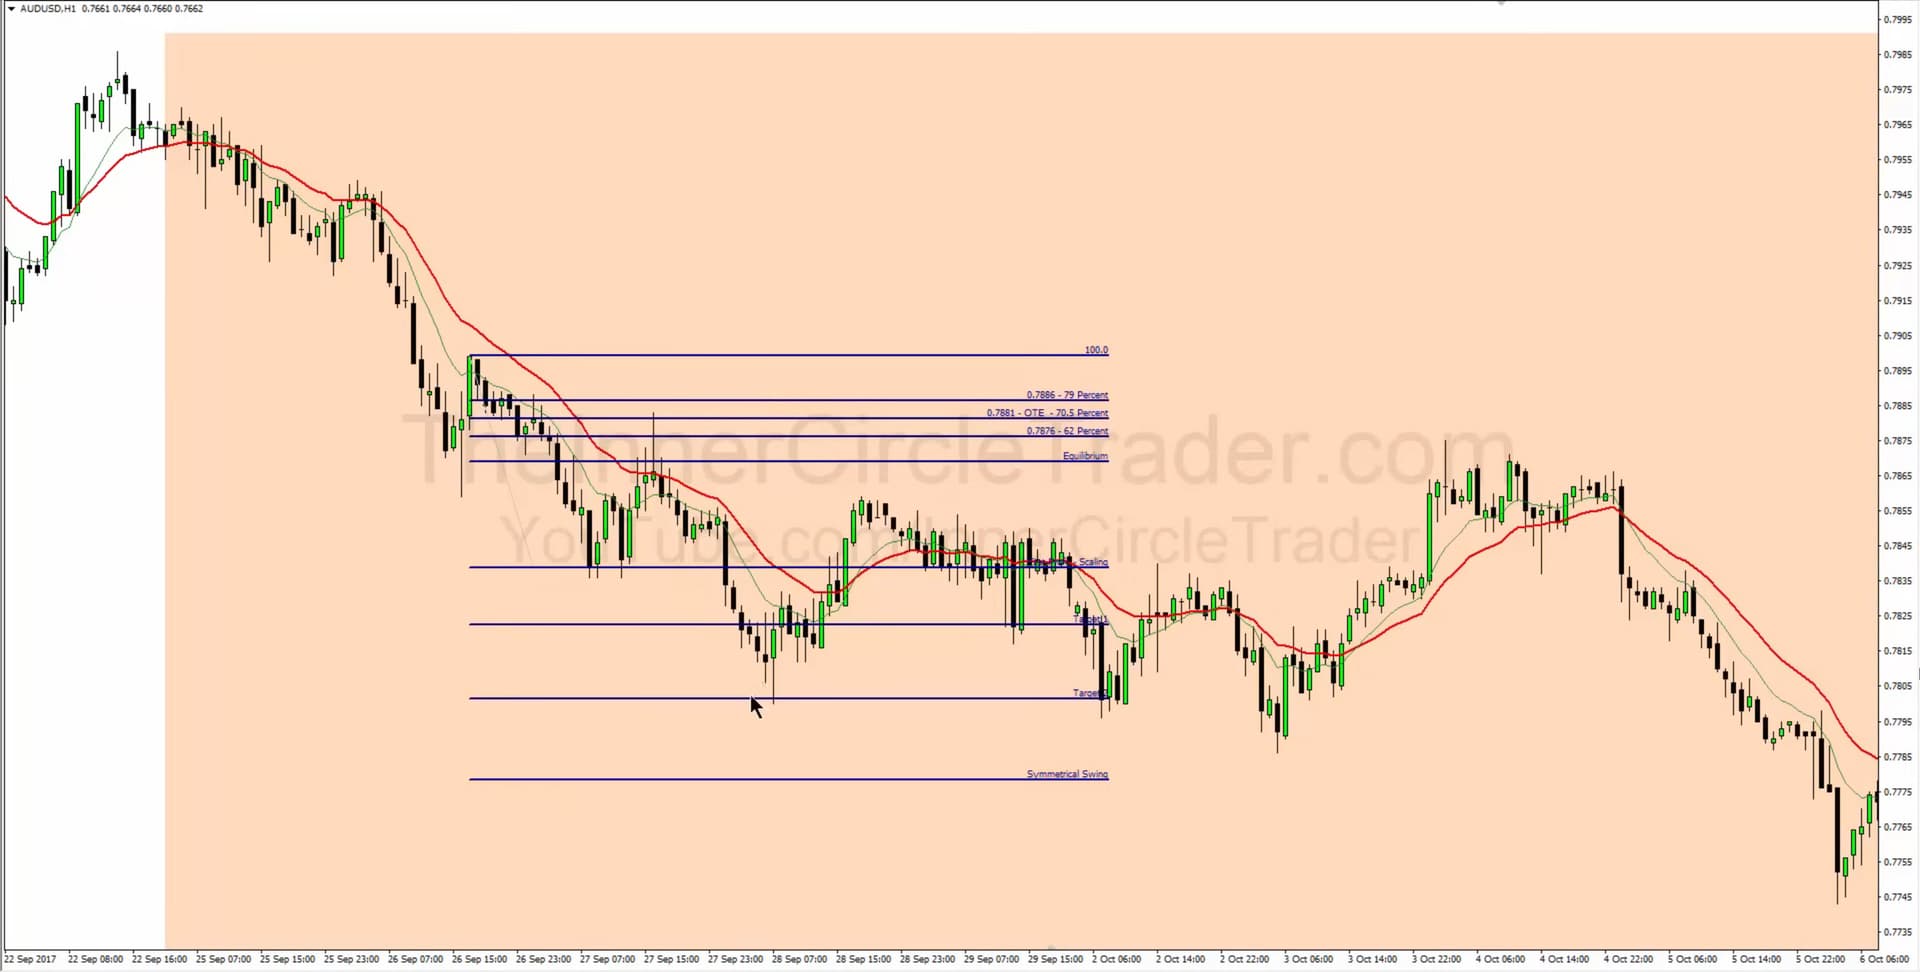
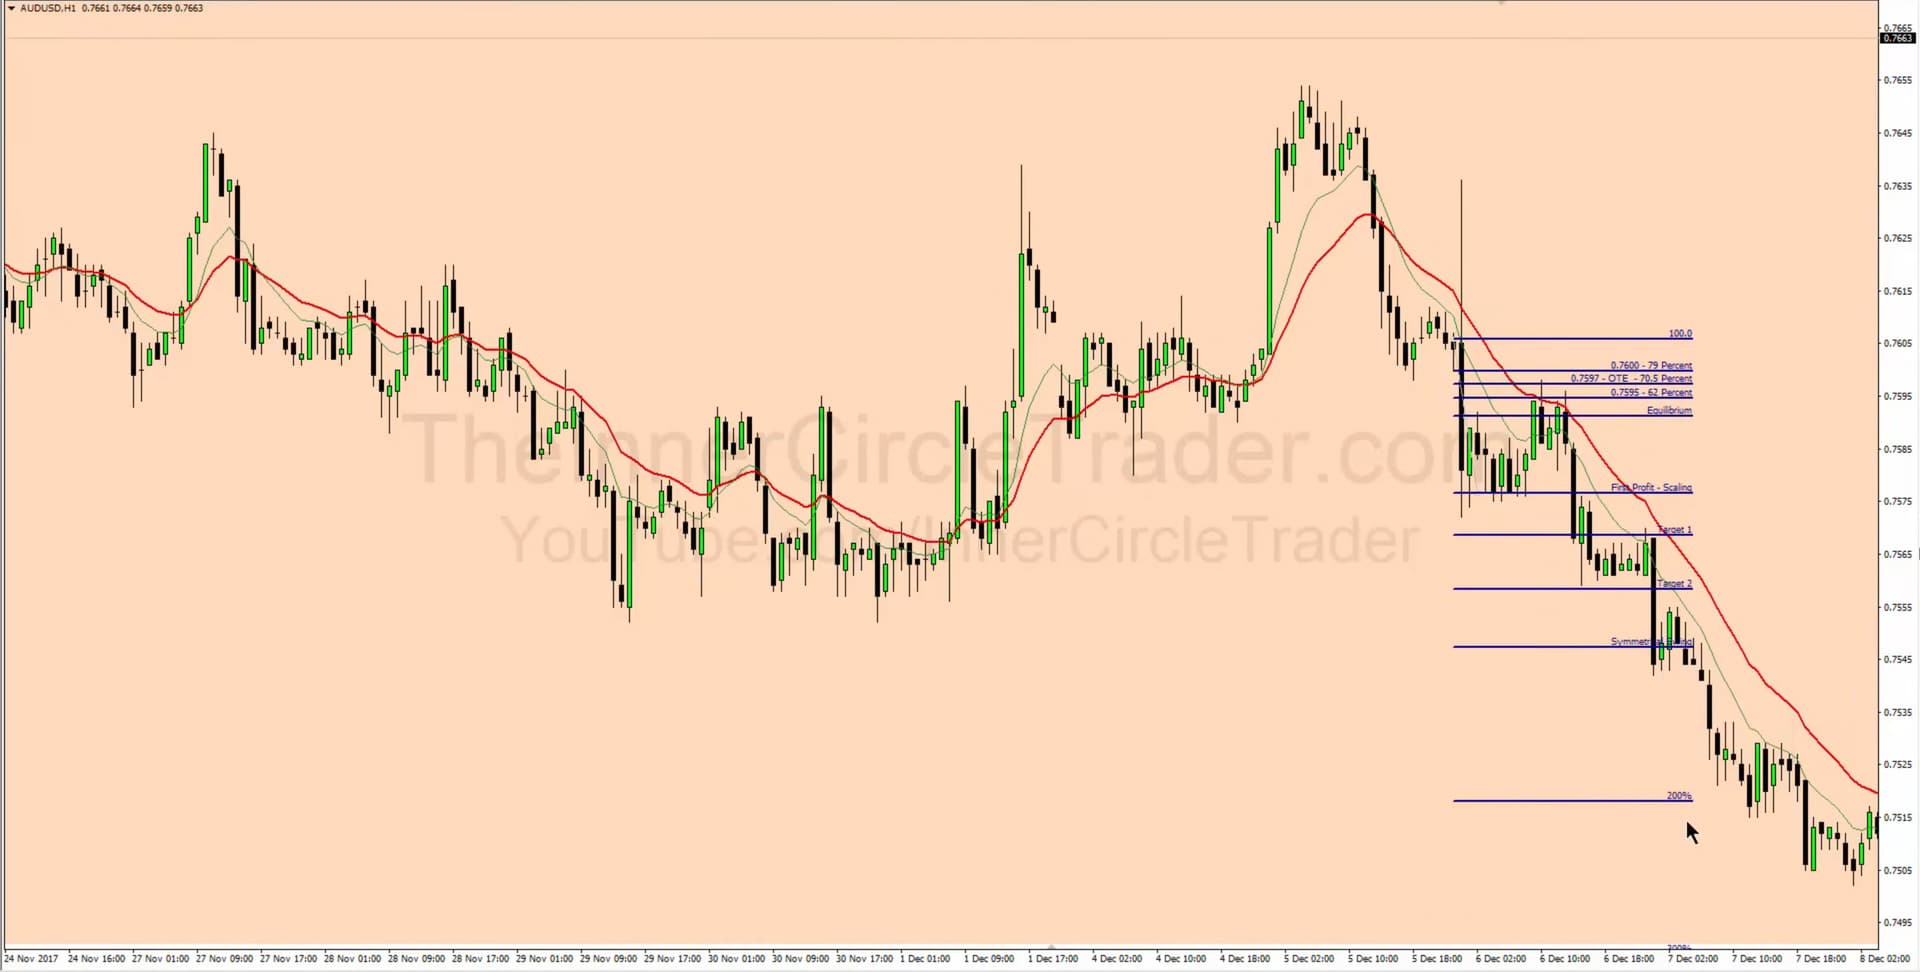
- After identifying a bullish or bearish condition on the daily chart, we switch to the hourly chart and look for the Optimal Trade Entry setups.
- If we are bullish, the 10-period moving average on the hourly chart must be above the 20-period moving average at the time of entry.
- If we are bearish, the 10-period moving average on the hourly chart must be below the 20-period moving average at the time of entry.
- Michael recommends taking partial profits and holding some portion for extended periods.
- Moving averages provide a structured approach to identifying market conditions. While not perfect, this method aligns with some long-term strategies used by large funds.
- Swing trades last several days to weeks.
Secrets To Swing Trading - Bullish Conditions On Daily Chart

Secrets To Swing Trading - Bullish OTE Trade Example

Secrets To Swing Trading - Bullish OTE Trade Example 2
Secrets To Swing Trading - Bullish OTE Trade Example 3
Secrets To Swing Trading - Bearish Conditions On Daily Chart
Secrets To Swing Trading - Bearish OTE Trade Example
Secrets To Swing Trading - Bearish OTE Trade Example 2
Secrets To Swing Trading - Bearish OTE Trade Example 3

Secrets To Swing Trading - Bearish OTE Trade Example 4
Secrets To Swing Trading - Bearish OTE Trade Example 5
Secrets To Swing Trading - Bearish OTE Trade Example 6
Secrets To Swing Trading - Bearish OTE Trade Example 7
Next lesson: ICT Forex - Scout Sniper Basic Field Guide - Volume 1
Previous lesson: ICT Forex - Market Maker Primer Course - Higher Time Frame Concepts