Notes
- Quarterly shifts apply to all asset classes.
- It happens because the market needs to generate interest from new buyers and sellers. To this purpose, it creates a sense of urgency or missed opportunity.
- The underlying is what you’re trading, and the benchmark is what you’re measuring for potential manipulation or lack thereof. For example, the underlying is EURUSD, and the benchmark is USDX.
- The algorithm will seek to do something in the first 20 days, 40 days, and 60 days after the most recent market structure shift.
- The first IPDA line will represent the first trading day of the previous month. For example, if it is November, the first IPDA line will correspond to the first trading day in October.
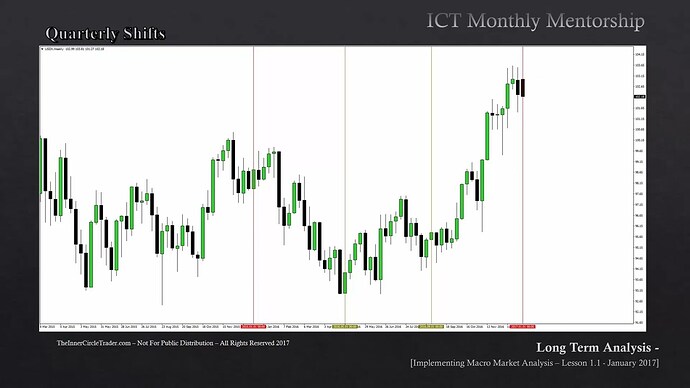
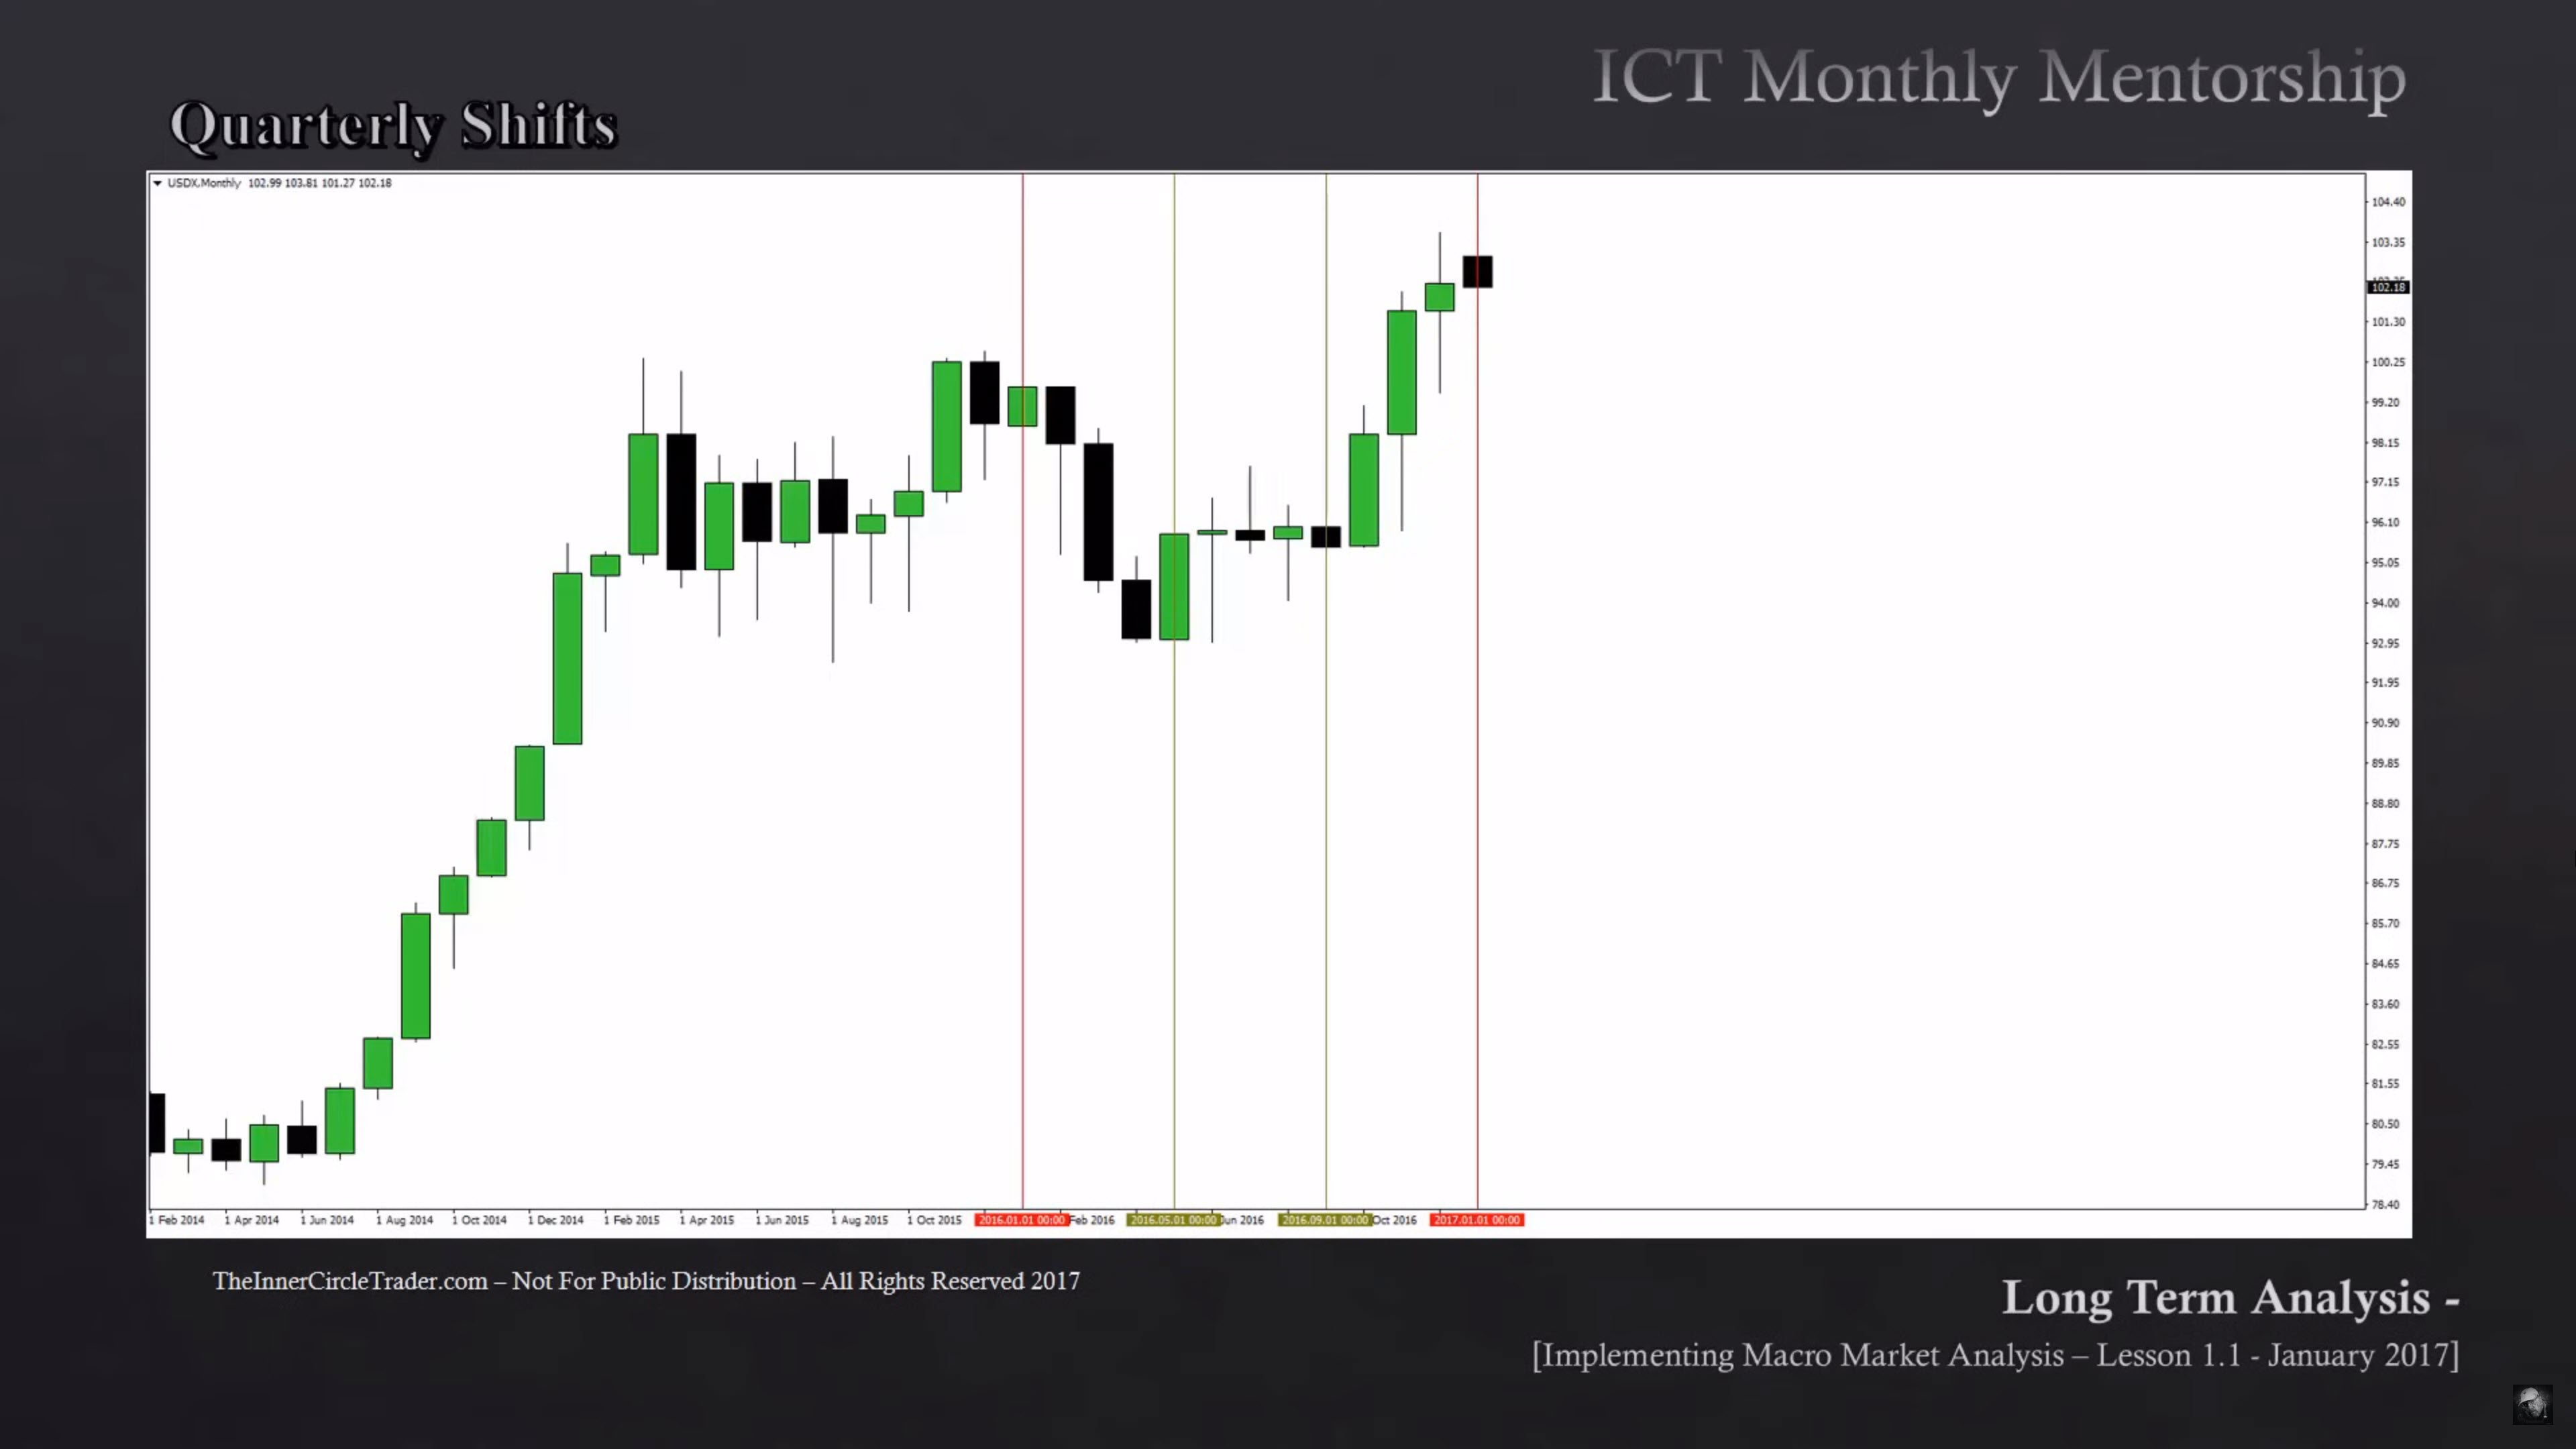
Quarterly Shifts - IPDA Data Ranges

Quarterly Shifts - IPDA Data Ranges Examples

Quarterly Shifts & IPDA Data Ranges - 3-Month Shifts

Quarterly Shifts & IPDA Data Ranges - 4-Month Shifts
Quarterly Shifts & IPDA Data Ranges - The Look Back

Quarterly Shifts & IPDA Data Ranges - Dollar Index Look Back Example

Quarterly Shifts & IPDA Data Ranges - The Cast Forward

Quarterly Shifts & IPDA Data Ranges - Dollar Index Cast Forward Example

Quarterly Shifts & IPDA Data Ranges - EURUSD Cast Forward Example

Next lesson: ICT Mentorship Core Content - Month 5 - Open Float
Previous lesson: ICT Mentorship Core Content - Month 4 - Double Bottom & Double Top