Notes
- According to Michael, the knowledge taught this month (January 2017/month 05) is the most important part of the mentorship.
- Michael recommends combining IPDA ranges with the analysis of weekly and monthly charts.
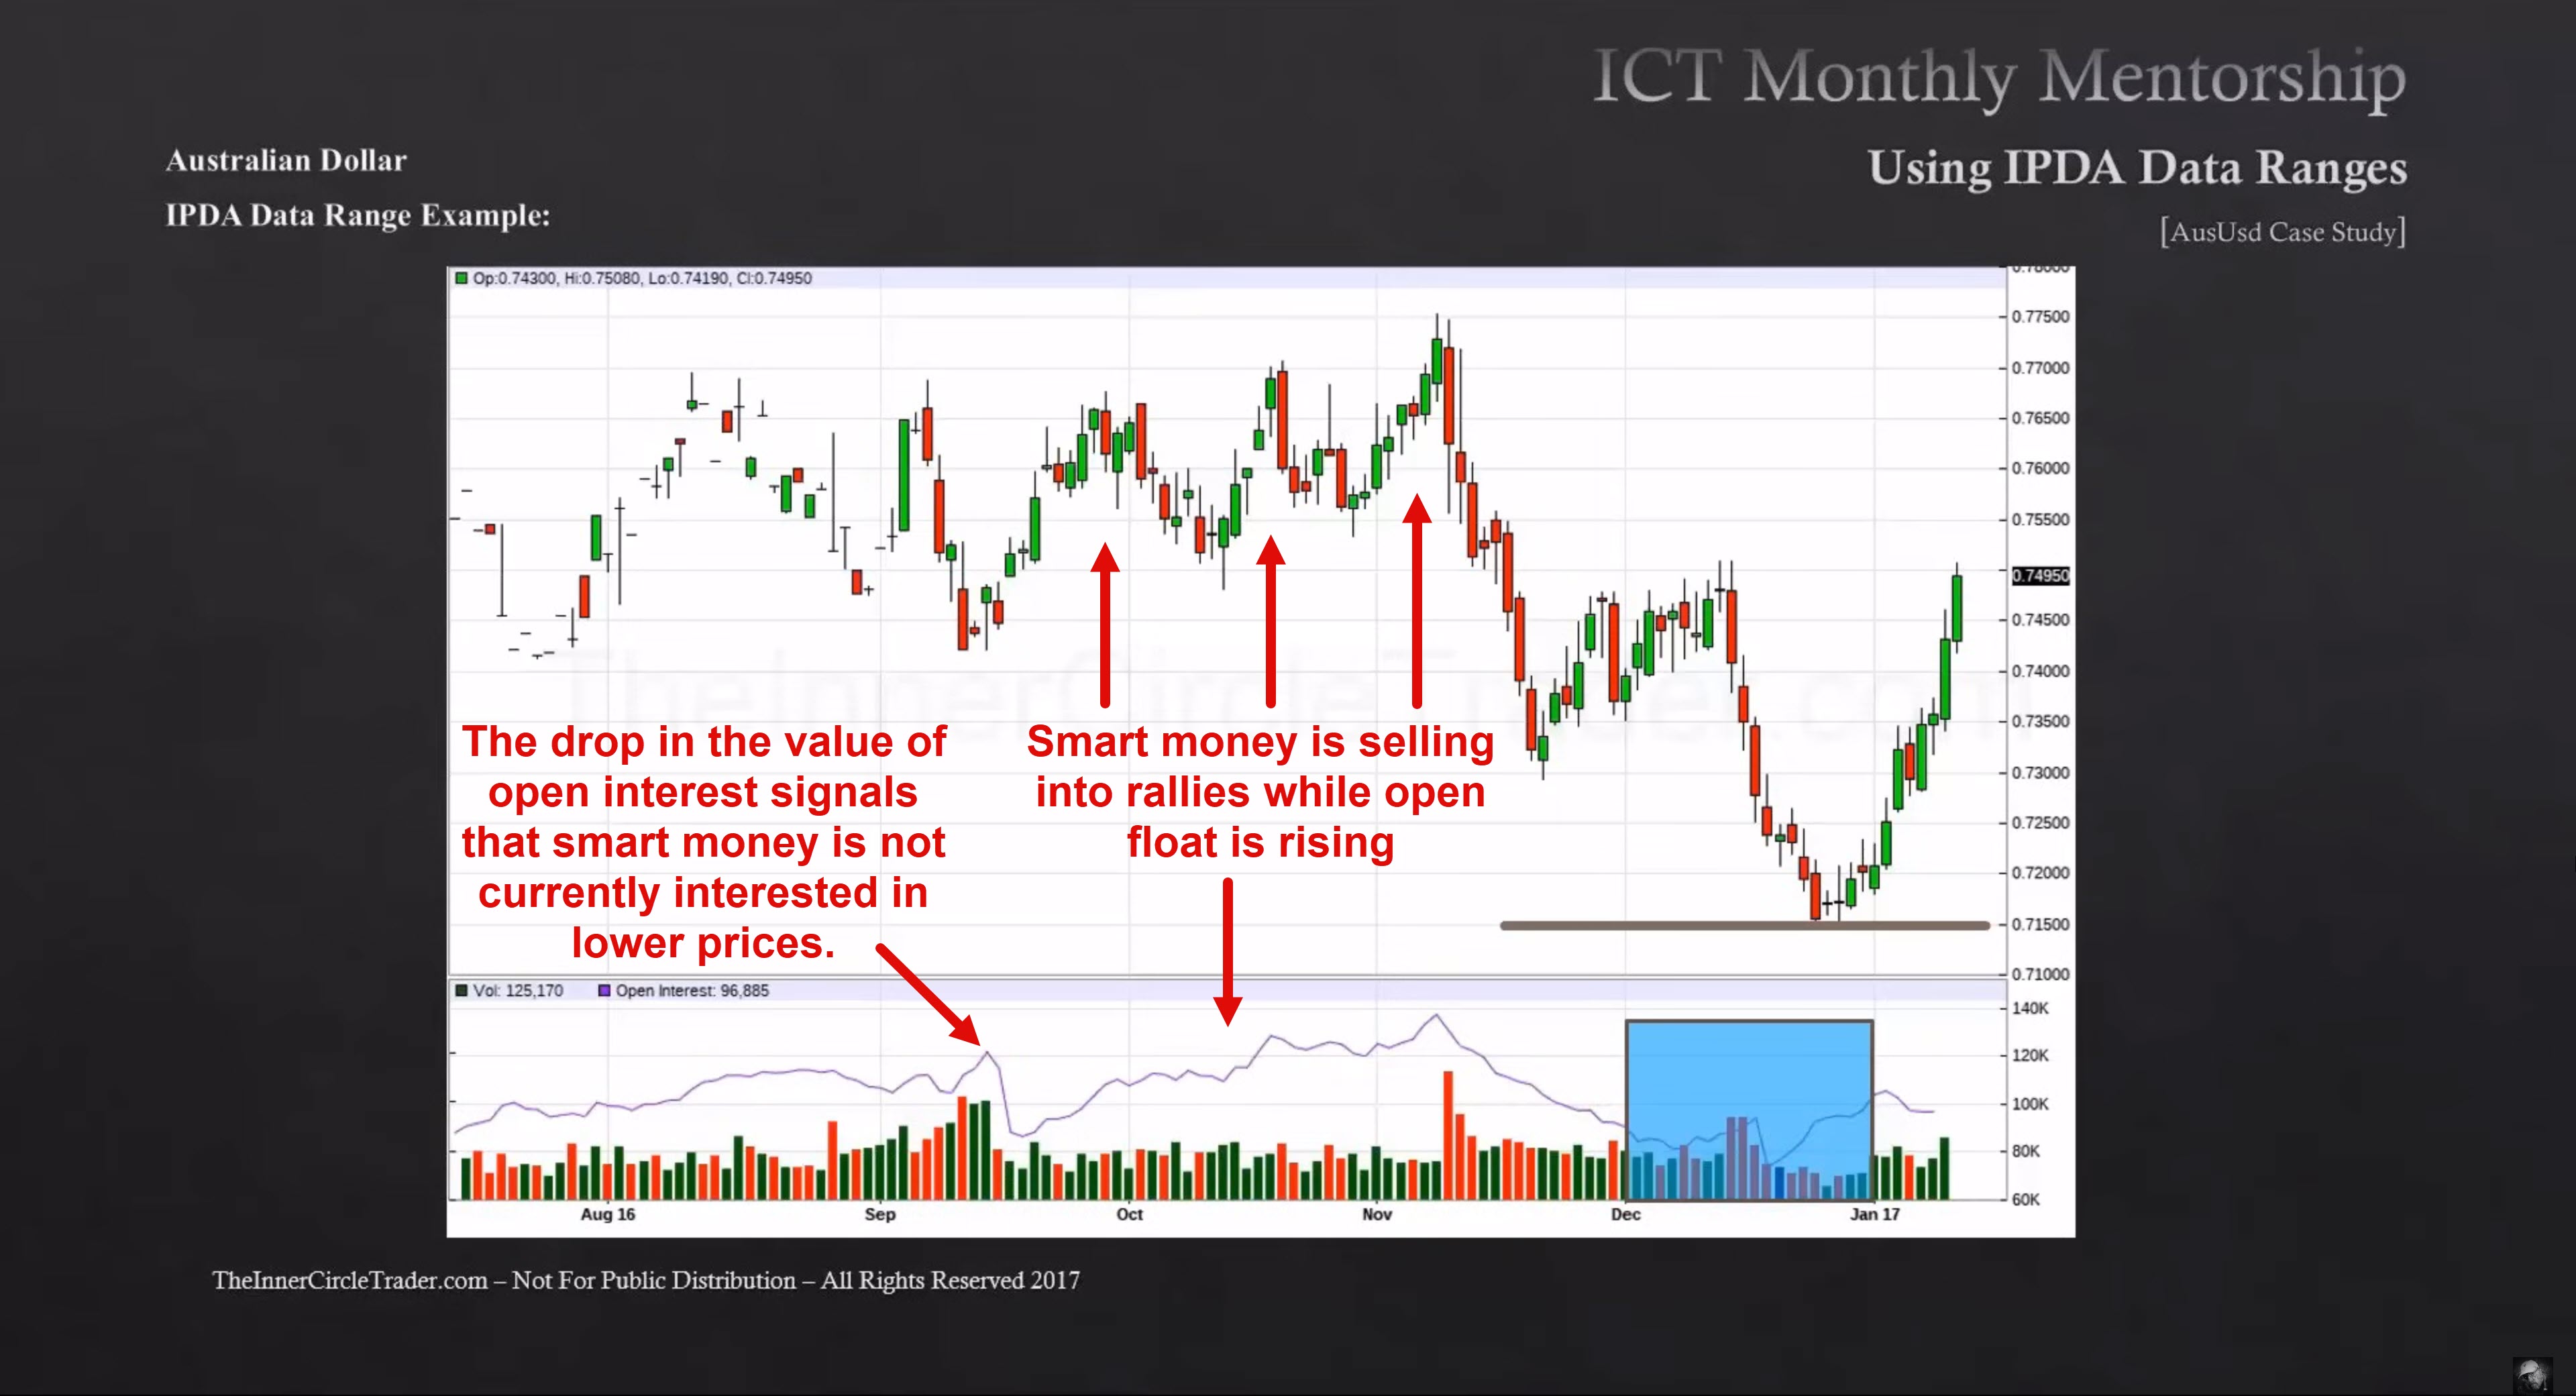
- To determine long-term bias, you can compare open interest values with prices on a daily chart. Futures should be used for this purpose.
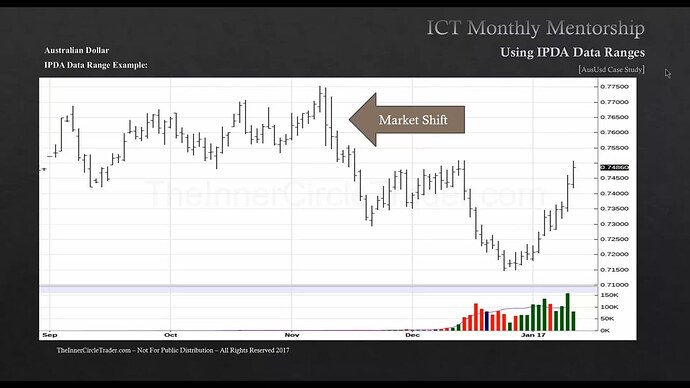
- Every three to four months, there is a market shift.
- A market shift is a displacement accompanied by a market structure shift on the daily chart.
- Once we take liquidity and have a market shift, we draw a line at the beginning of the month in which it occurred. This will serve as a baseline from which we will predict the market’s future turnover (new market shift) at intervals of 20, 40, and 60 days.
Using IPDA Data Ranges - Market Shift

Using IPDA Data Ranges - Smart Money Accumulation
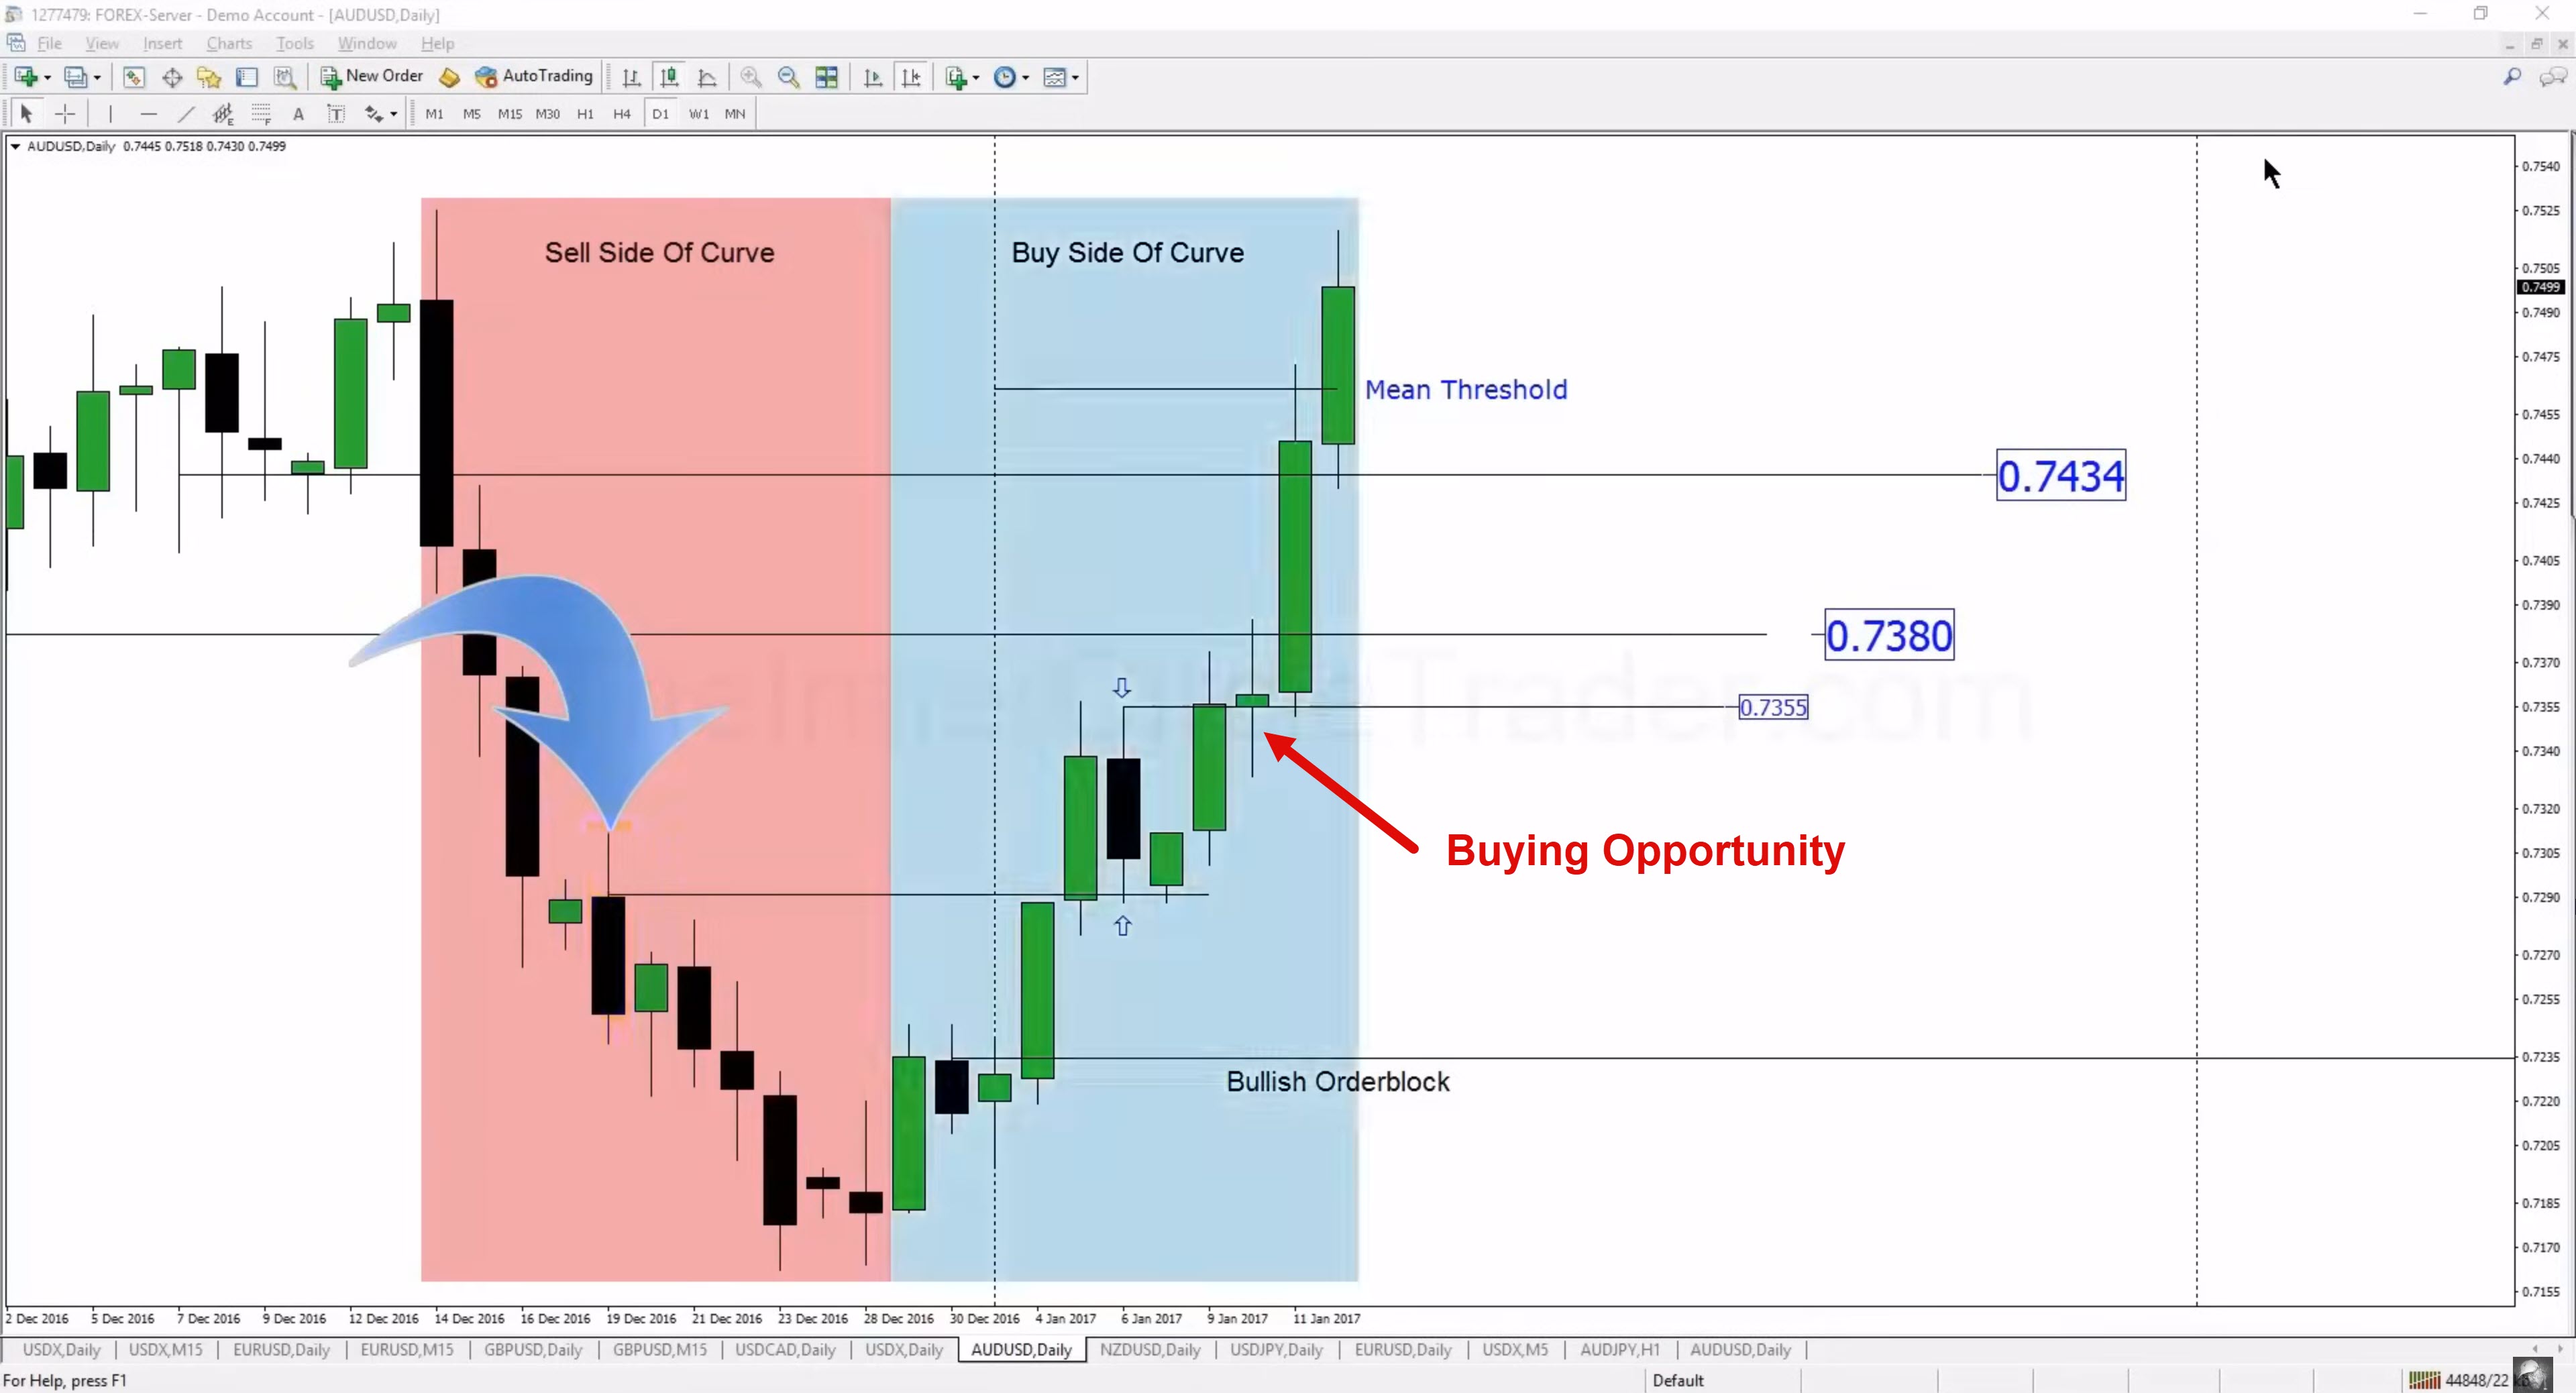
Using IPDA Data Ranges - AUDUSD Example
Next lesson: ICT Mentorship Core Content - Month 5 - Defining Open Float Liquidity Pools
Previous lesson: ICT Mentorship Core Content - Month 5 - Open Float