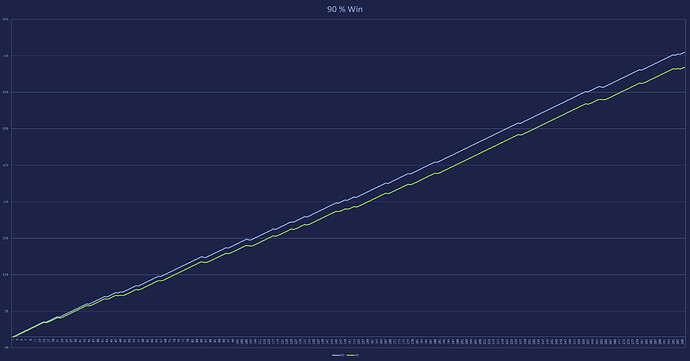
If you have ever wondered how effective the money management Michael presented in his lessons is, here is the answer.
First, here are the rules that Michael published in the Price Action Models Series.
I compared the above money management model with the traditional way, i.e. 1 % per trade (in this case 1R per trade).
The 1R per trade was used to avoid the effect of compound interest on the resulting equity curve.
So here are the default values for both models:
Traditional MM
- Risk = 1R
- Reward = 3R
Michael’s MM
- Risk 1 = 1R
- Risk 2 = 0.5R
- Risk 3 = 0.25R
- Reward 1 = 3R
- Reward 2 = 1.5R
- Reward 3 = 0.75R
300 hypothetical trades
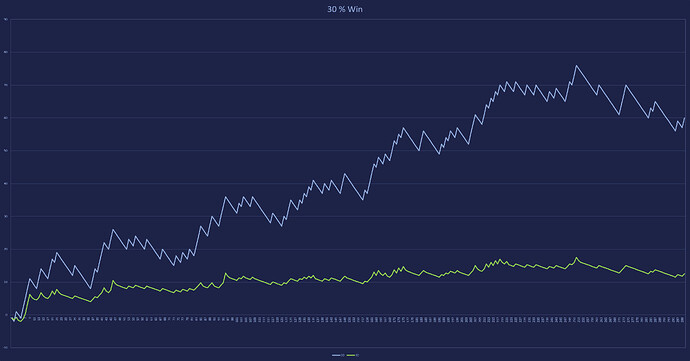
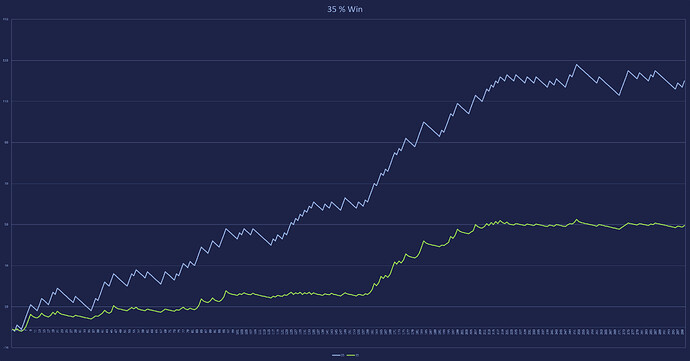
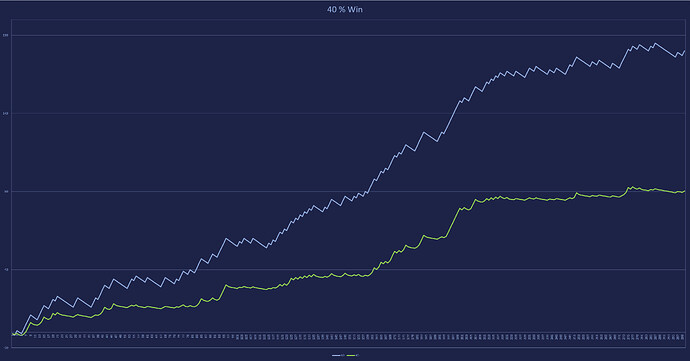
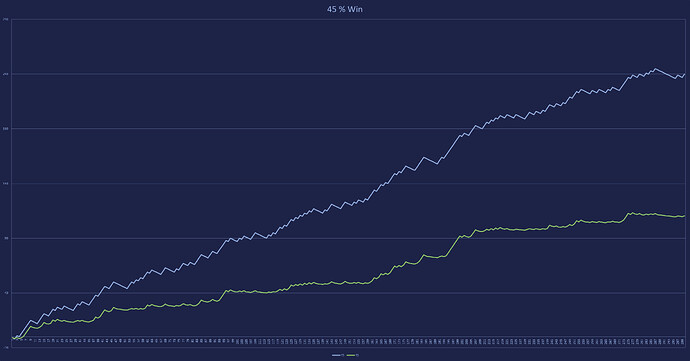
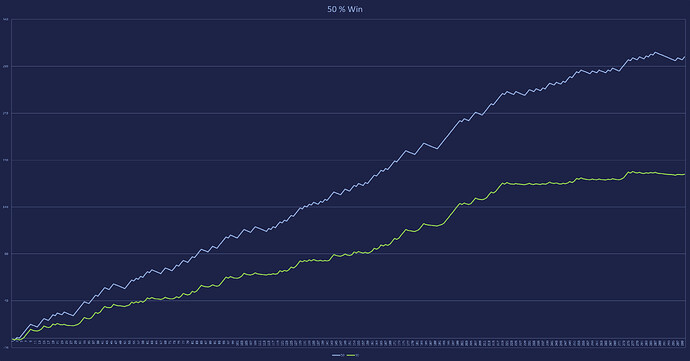
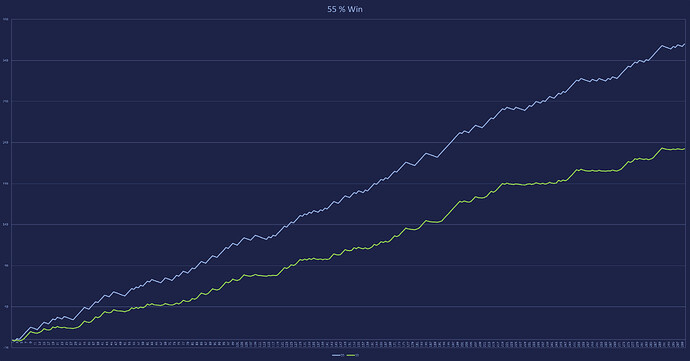
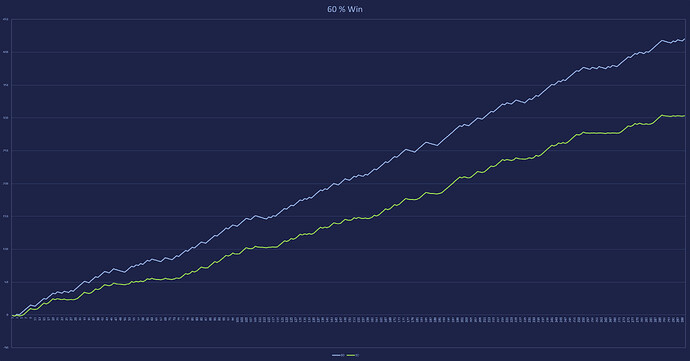
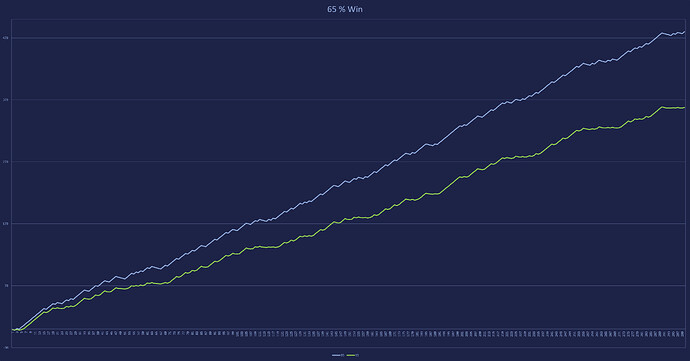
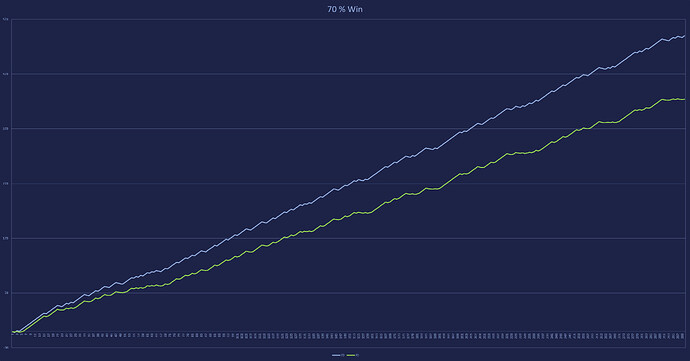
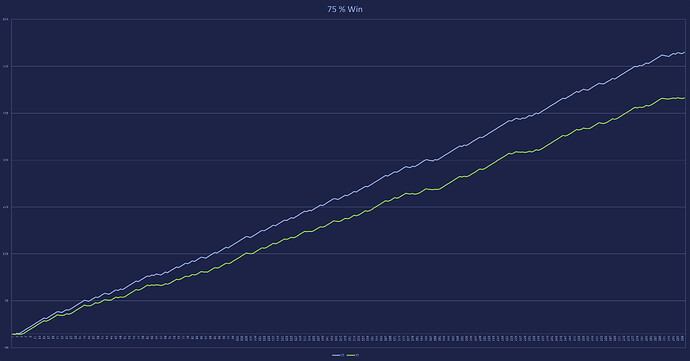
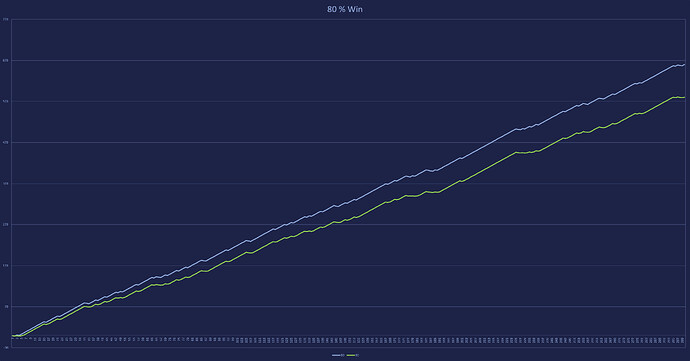
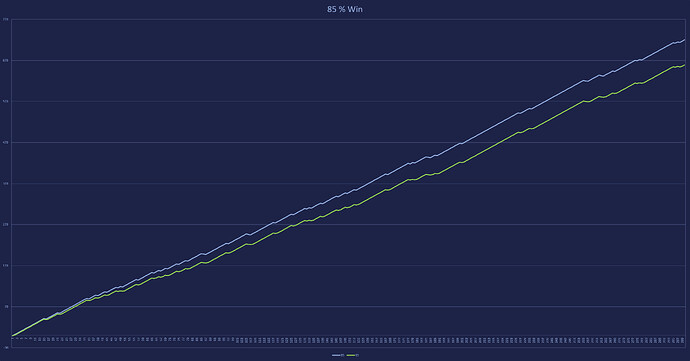
The following screenshots demonstrate hypothetical results for different win rate values.
Blue line = Traditional MM
Green line = Michael’s MM
Conclusion
The basic idea of Michael’s money management is to protect capital in times when the trader is not doing very well. This makes the drawdowns much smaller, but it also makes it harder to get to new equity highs. These facts are quite clear in the charts above.
The traditional model, on the other hand, will always have slightly larger drawdowns but performs similarly in good times (win rate above 60% in this case).
So as always, it’s down to personal preference. I prefer simplicity and that is why the 1R per trade model wins for me.
