
Key Takeaways
- Only focus on setups within the true day.
- You only need one pattern and stick to it.
- Michael says he only trades the two setups below and does not seek anything else.
- When OTE overlaps with FVG or OB, the setup success rate increases.
- Every pattern presented is universal, it can be seen in every single time frame.
- When Michael opens the charts, the first thing he does is ask himself, “Where are the breakers?”
- Michael is looking for breakers on all his time frames.
ICT Top Down Analysis - Michael’s Personal Approach

Analysis Process
- Day Of Week
- IPDA True Day
- Time Of Day - Killzones
- Flout - CBDR And Asian Range
- Asian Range
- CBDR - Central Bank Deviations
- Intraday Profiles
- PD Arrays And Key Levels
- ADR Projections
ICT Top Down Analysis - Day Of Week

ICT Top Down Analysis - IPDA True Day

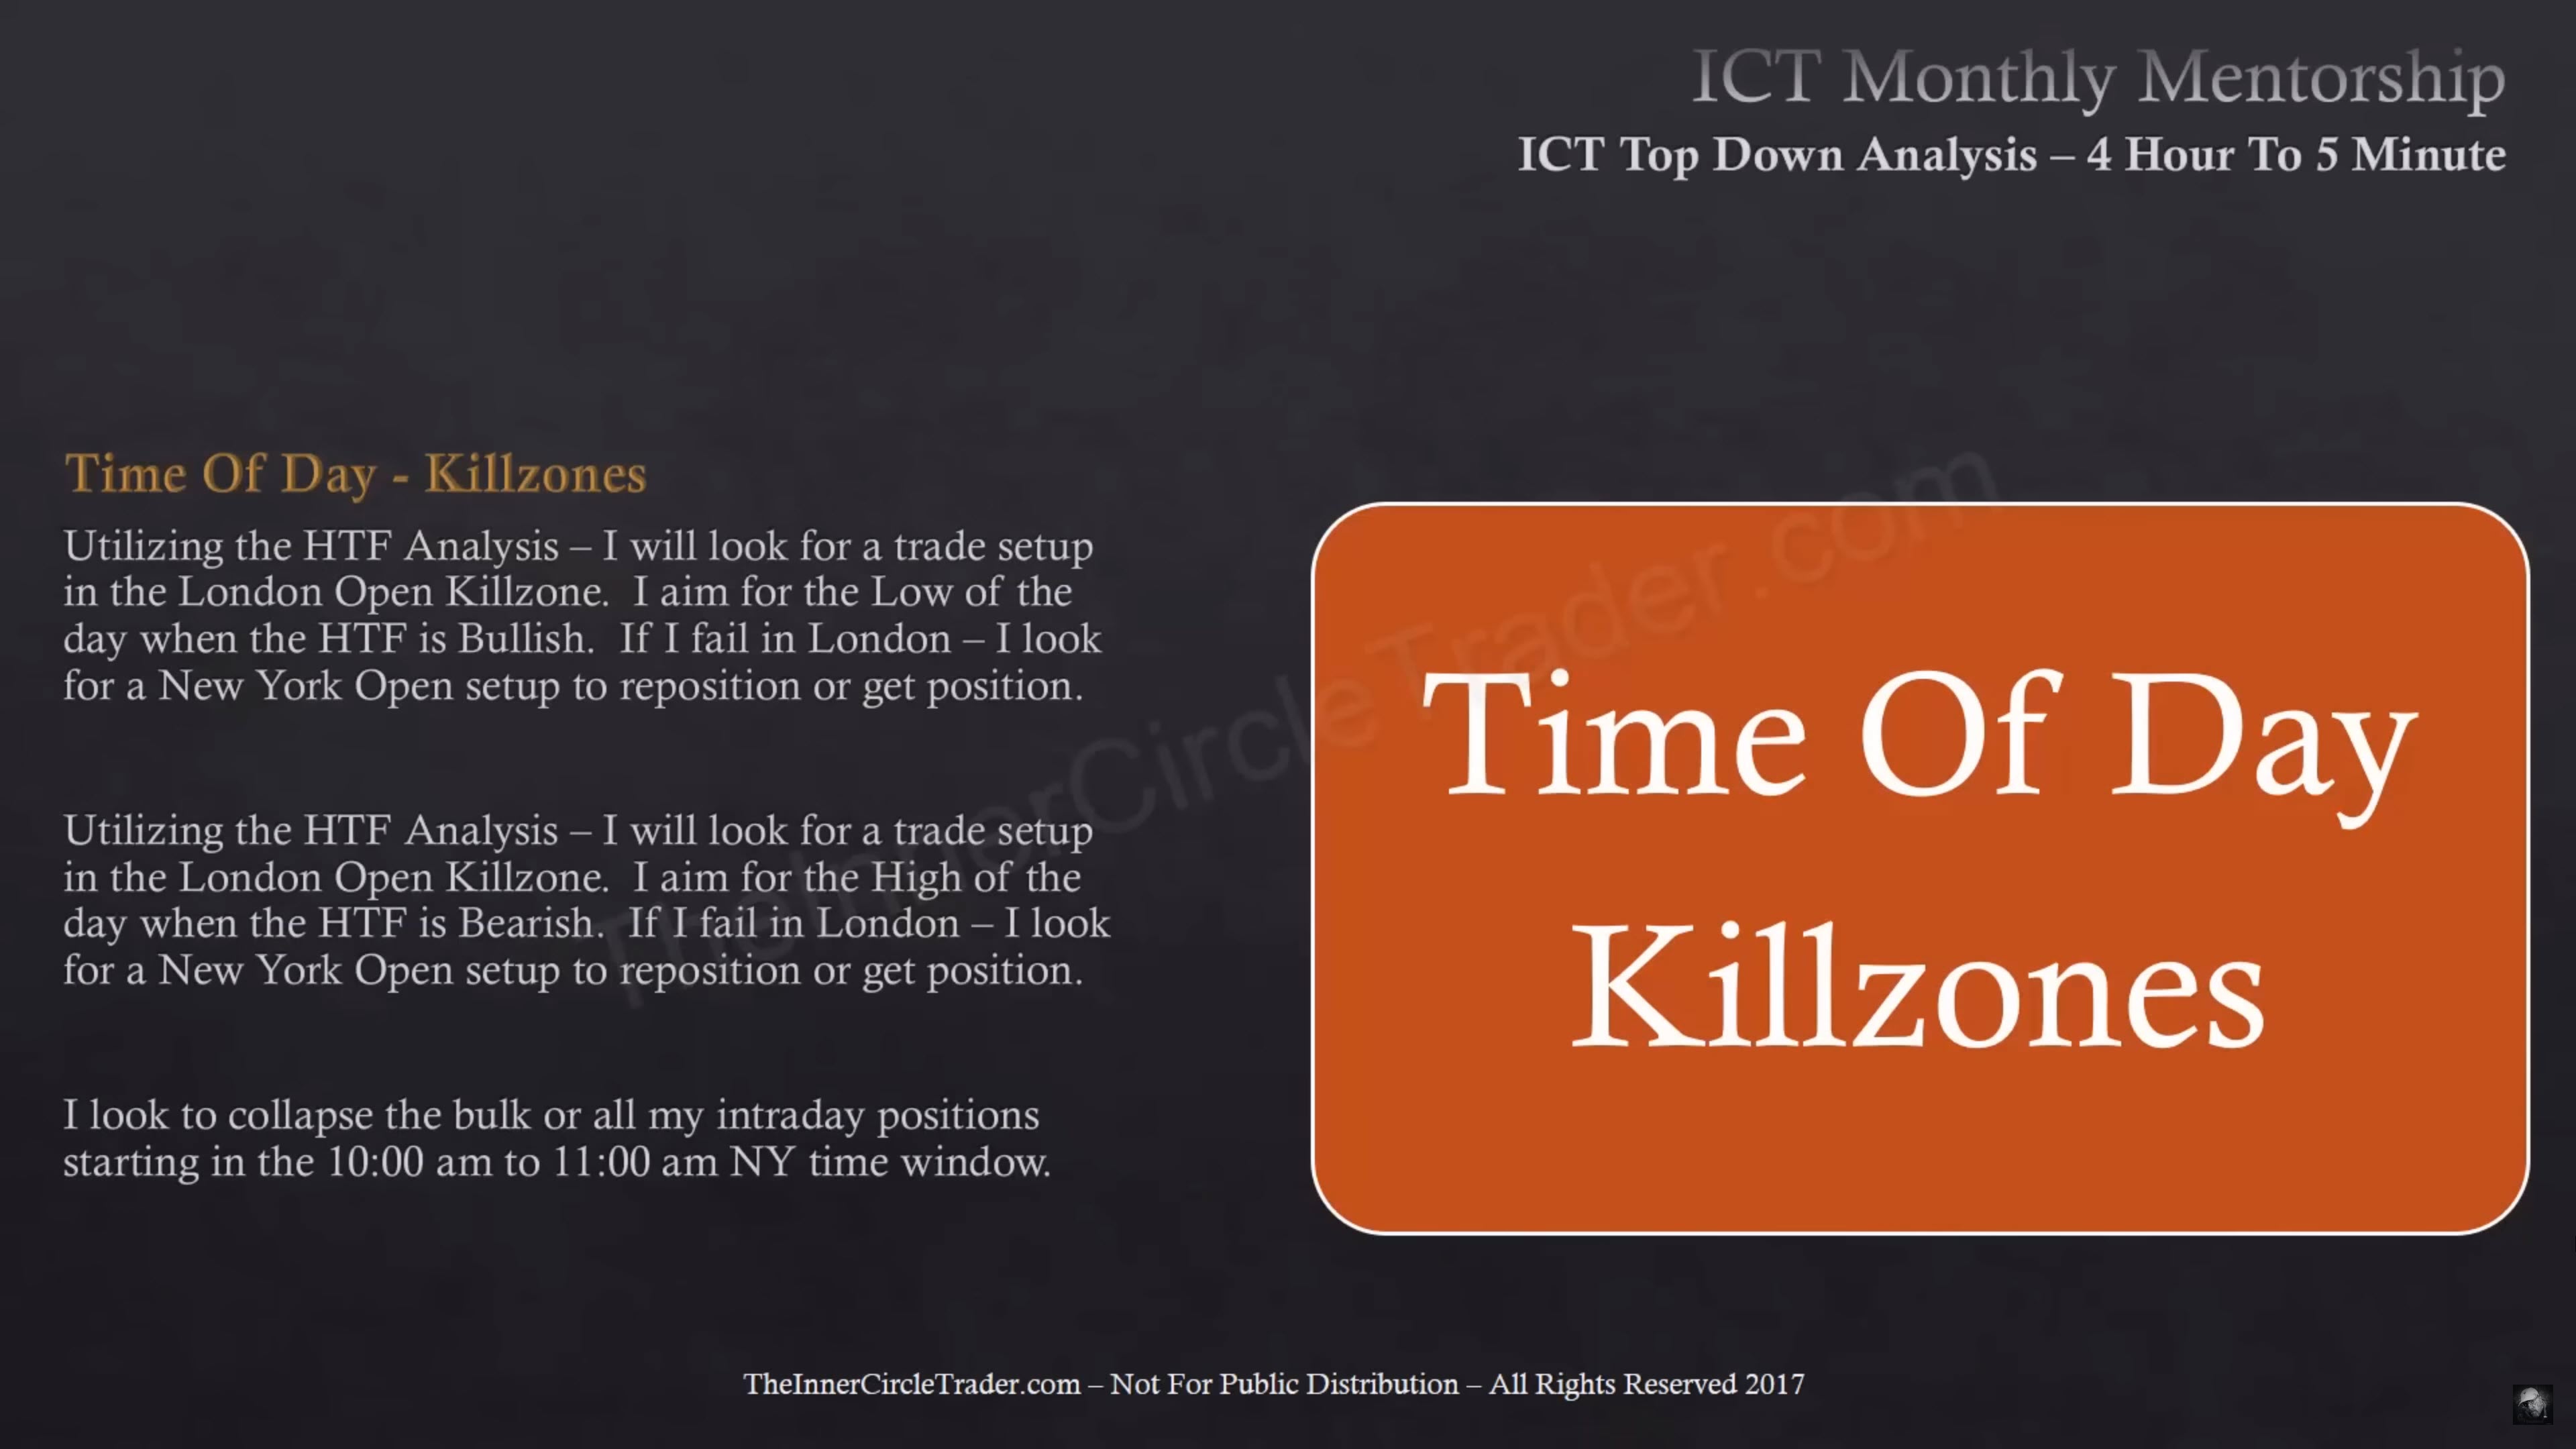
ICT Top Down Analysis - Time Of Day - Killzones
ICT Top Down Analysis - Flout - CBDR And Asian Range

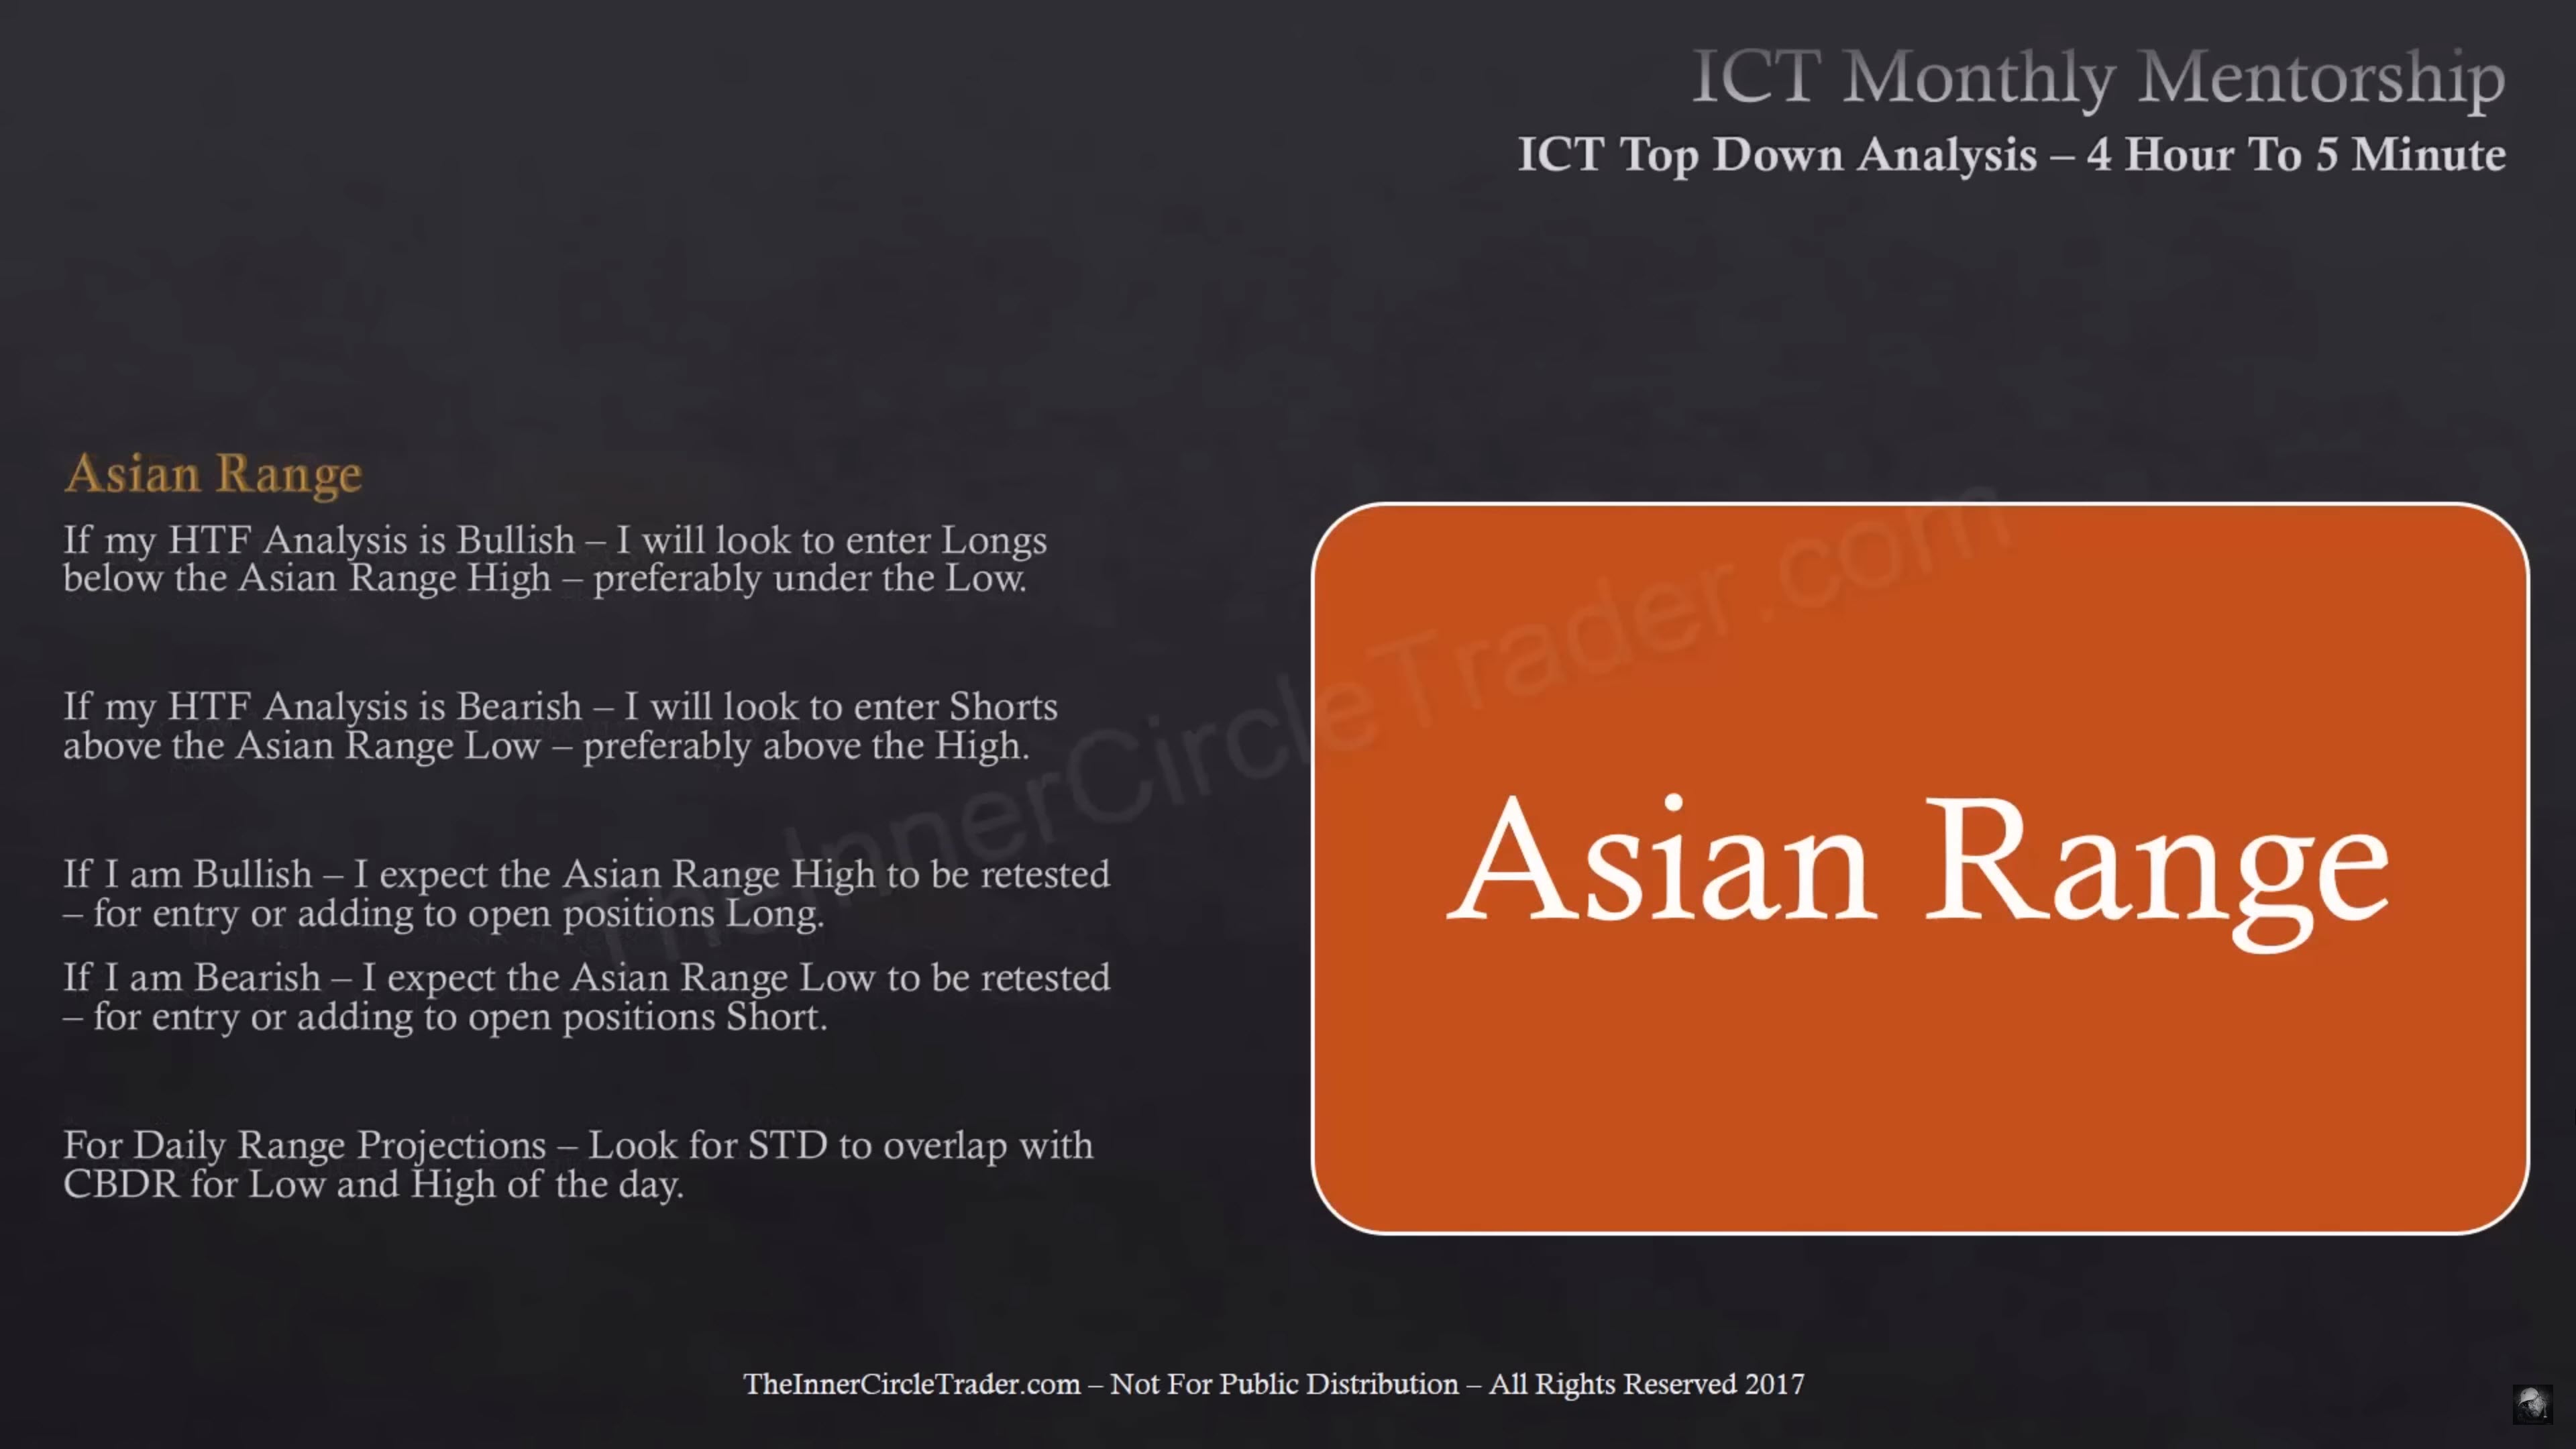
ICT Top Down Analysis - Asian Range
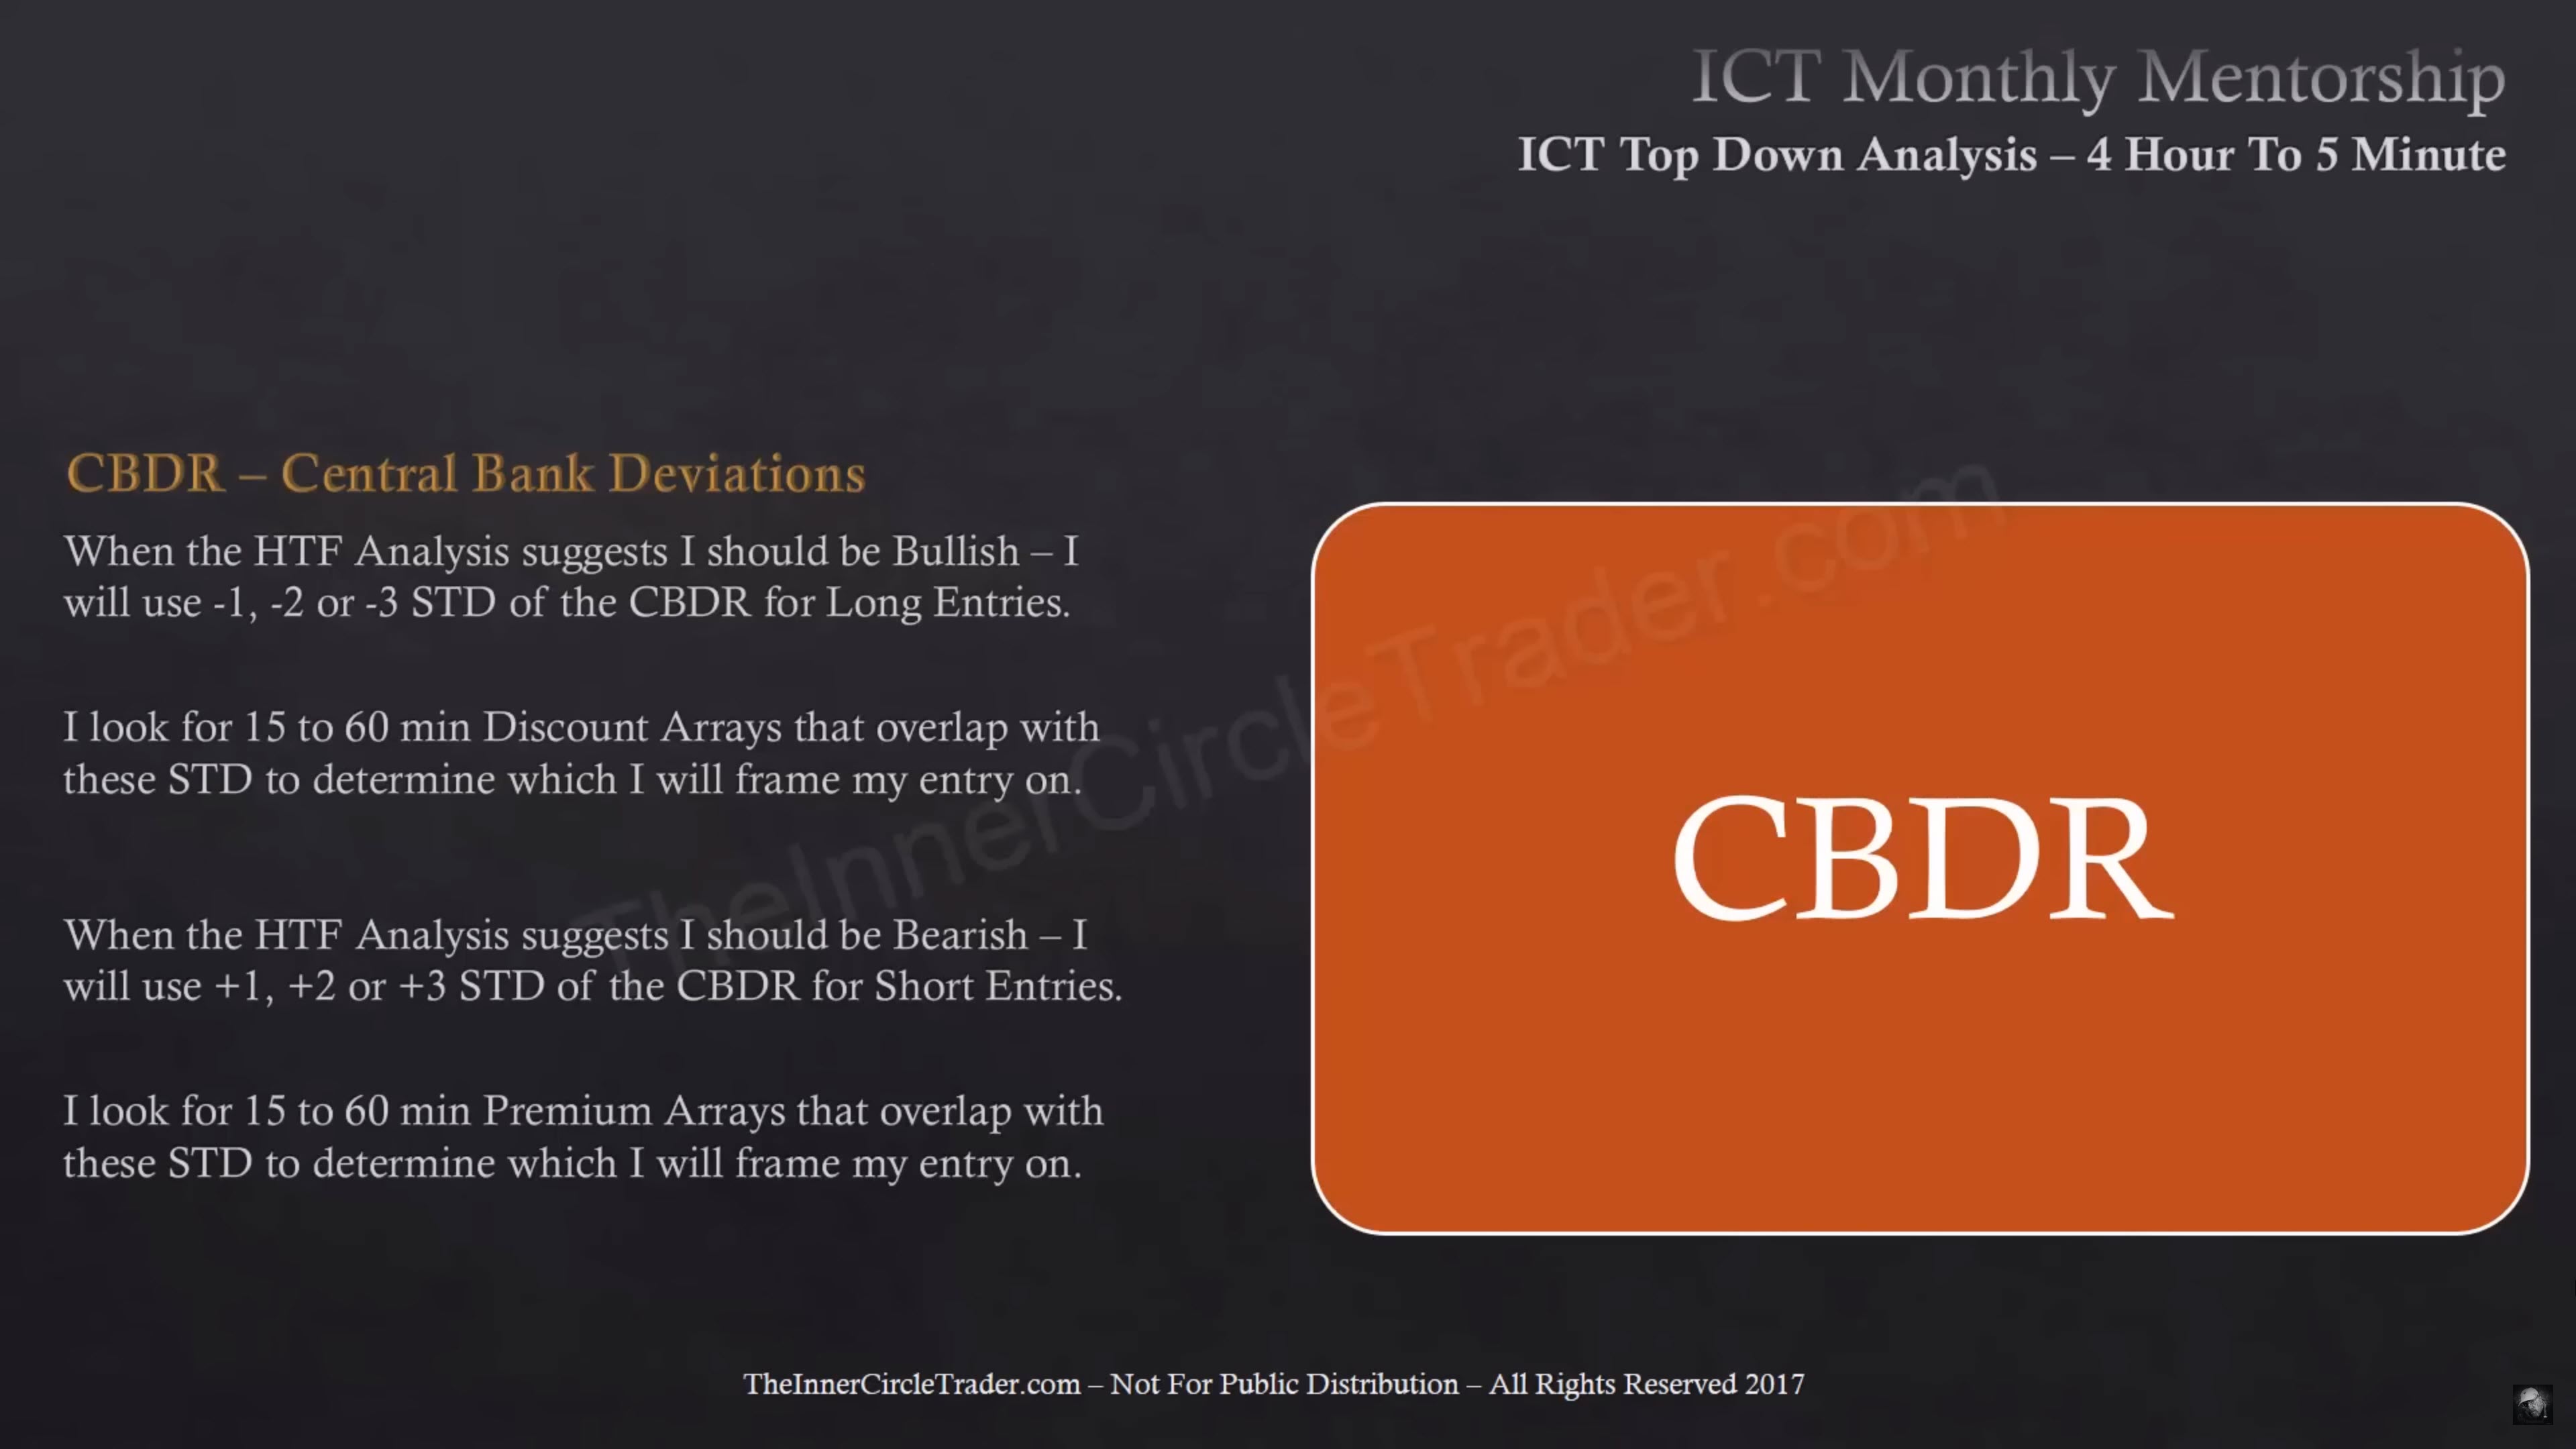
ICT Top Down Analysis - CBDR - Central Bank Deviations
ICT Top Down Analysis - Intraday Profiles

ICT Top Down Analysis - PD Arrays And Key Levels

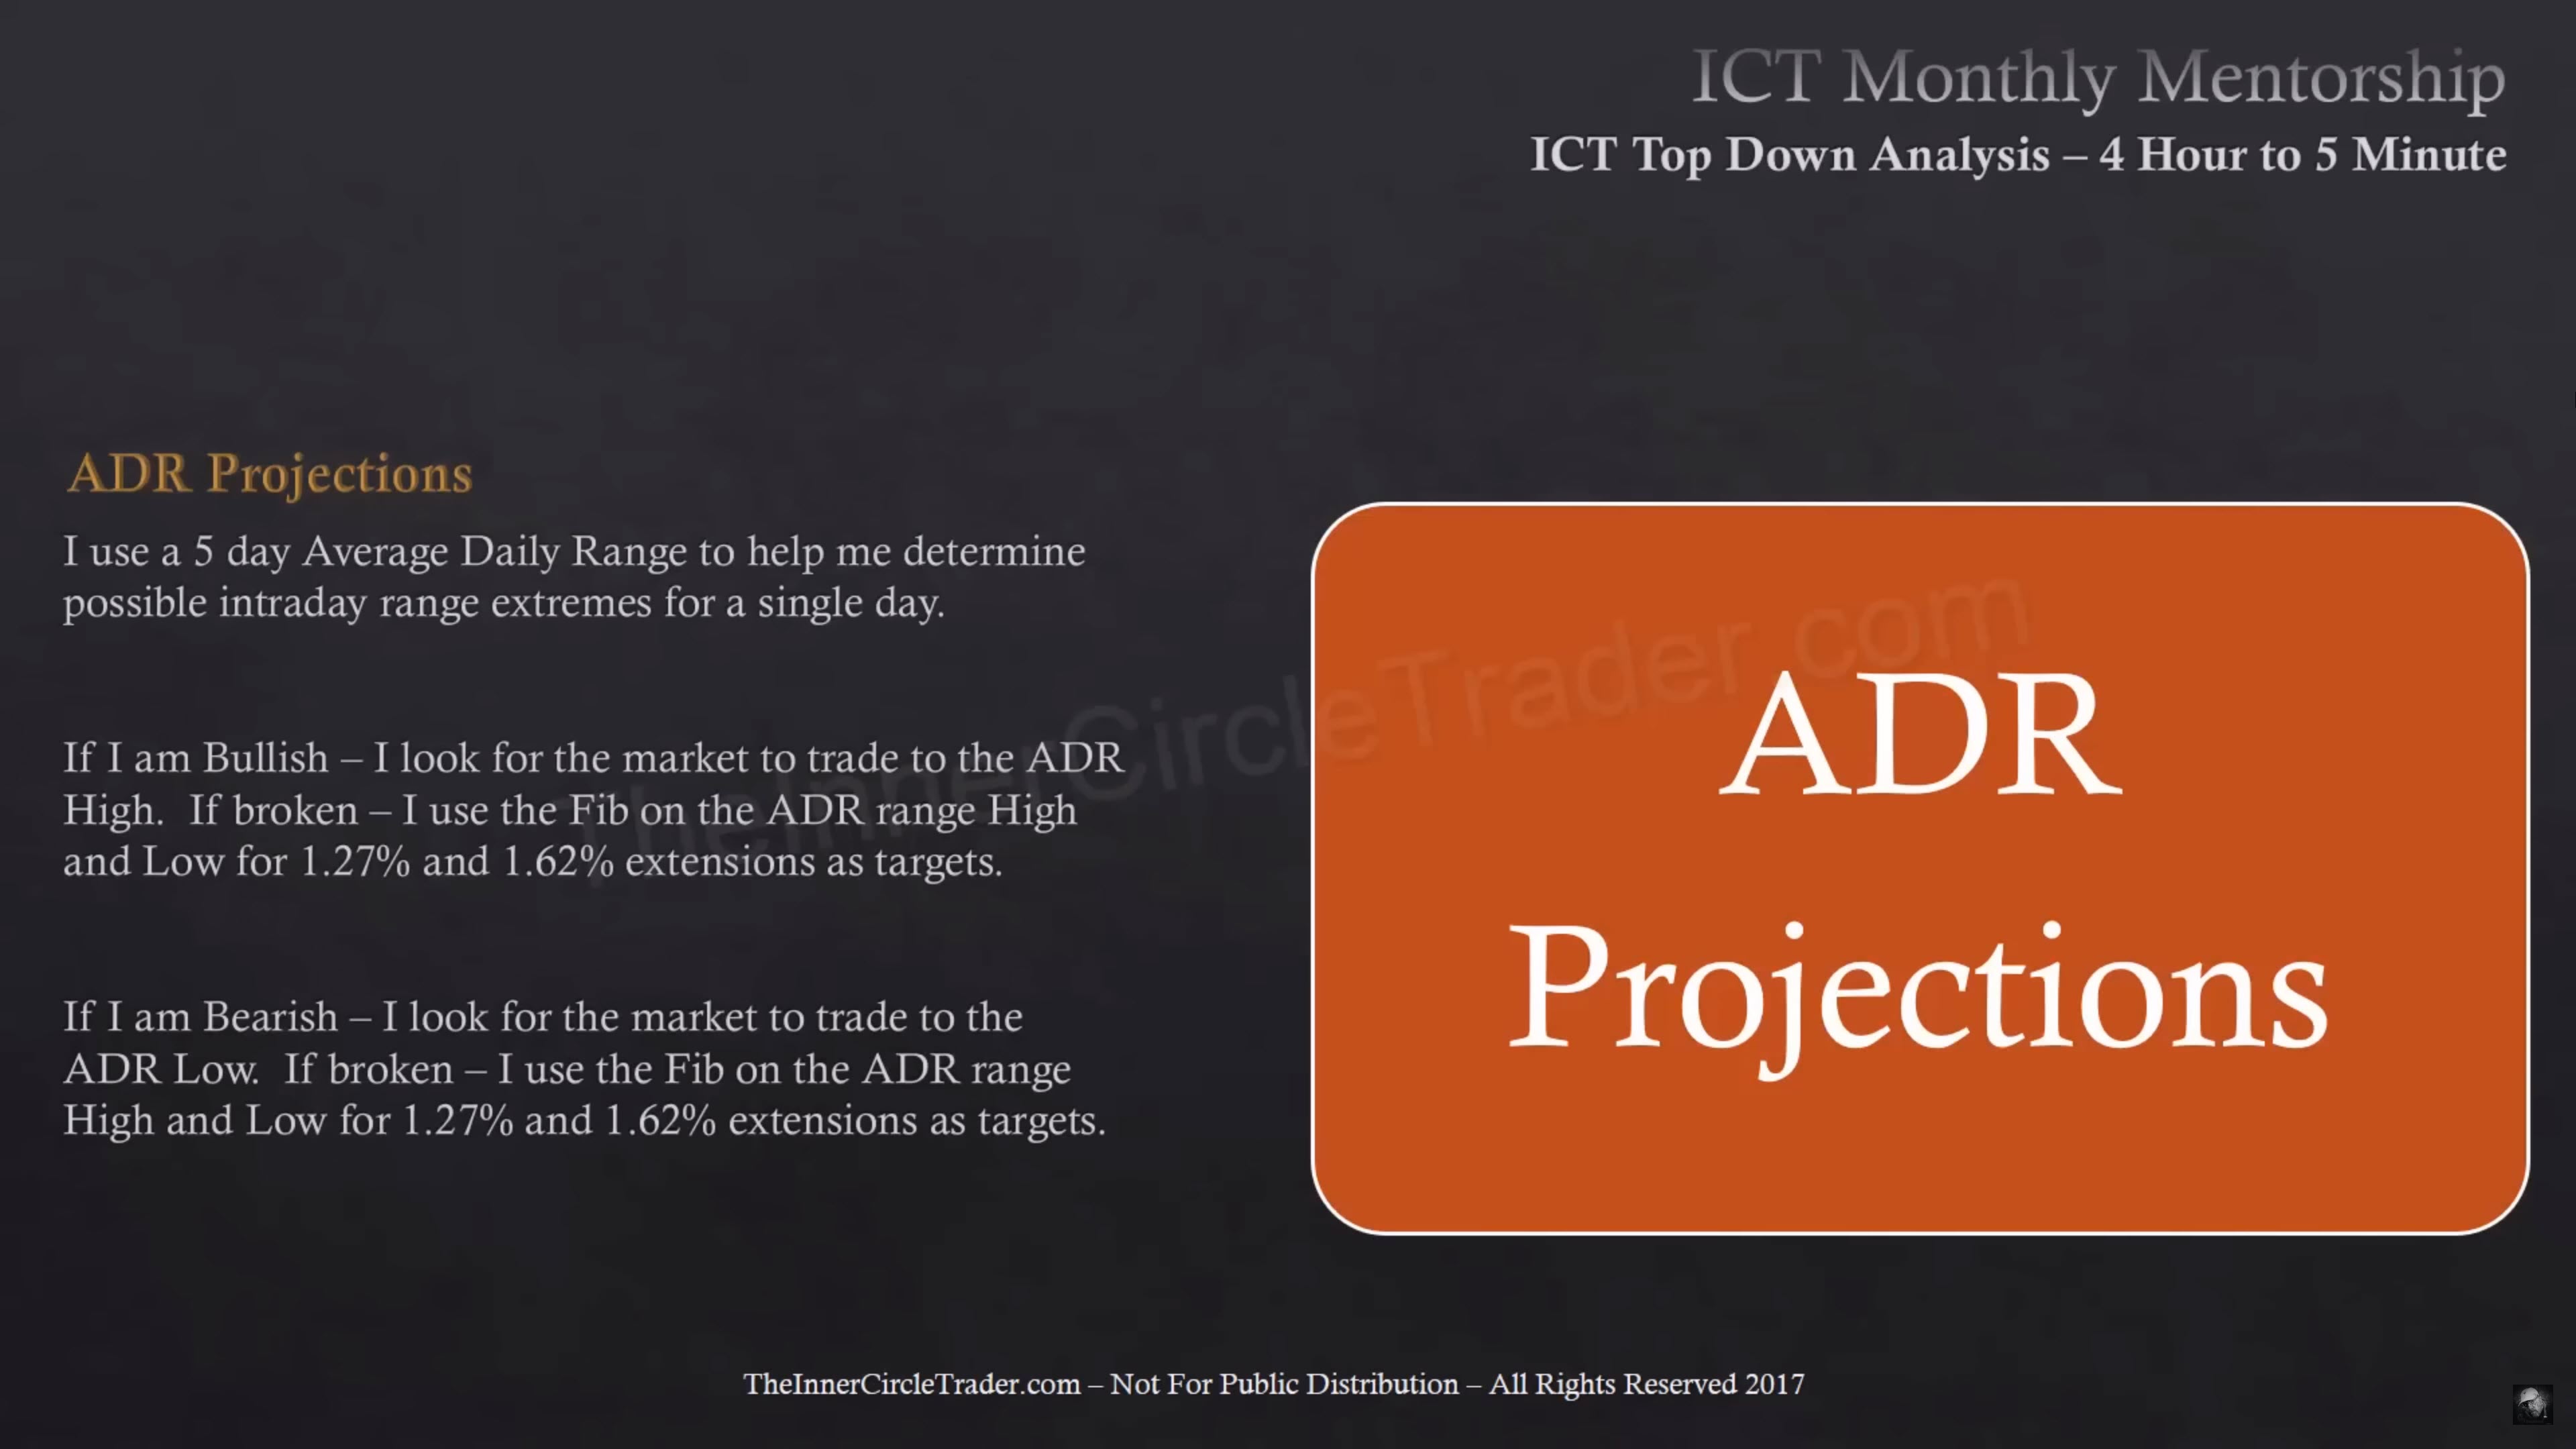
ICT Top Down Analysis - ADR Projections
ICT Setups
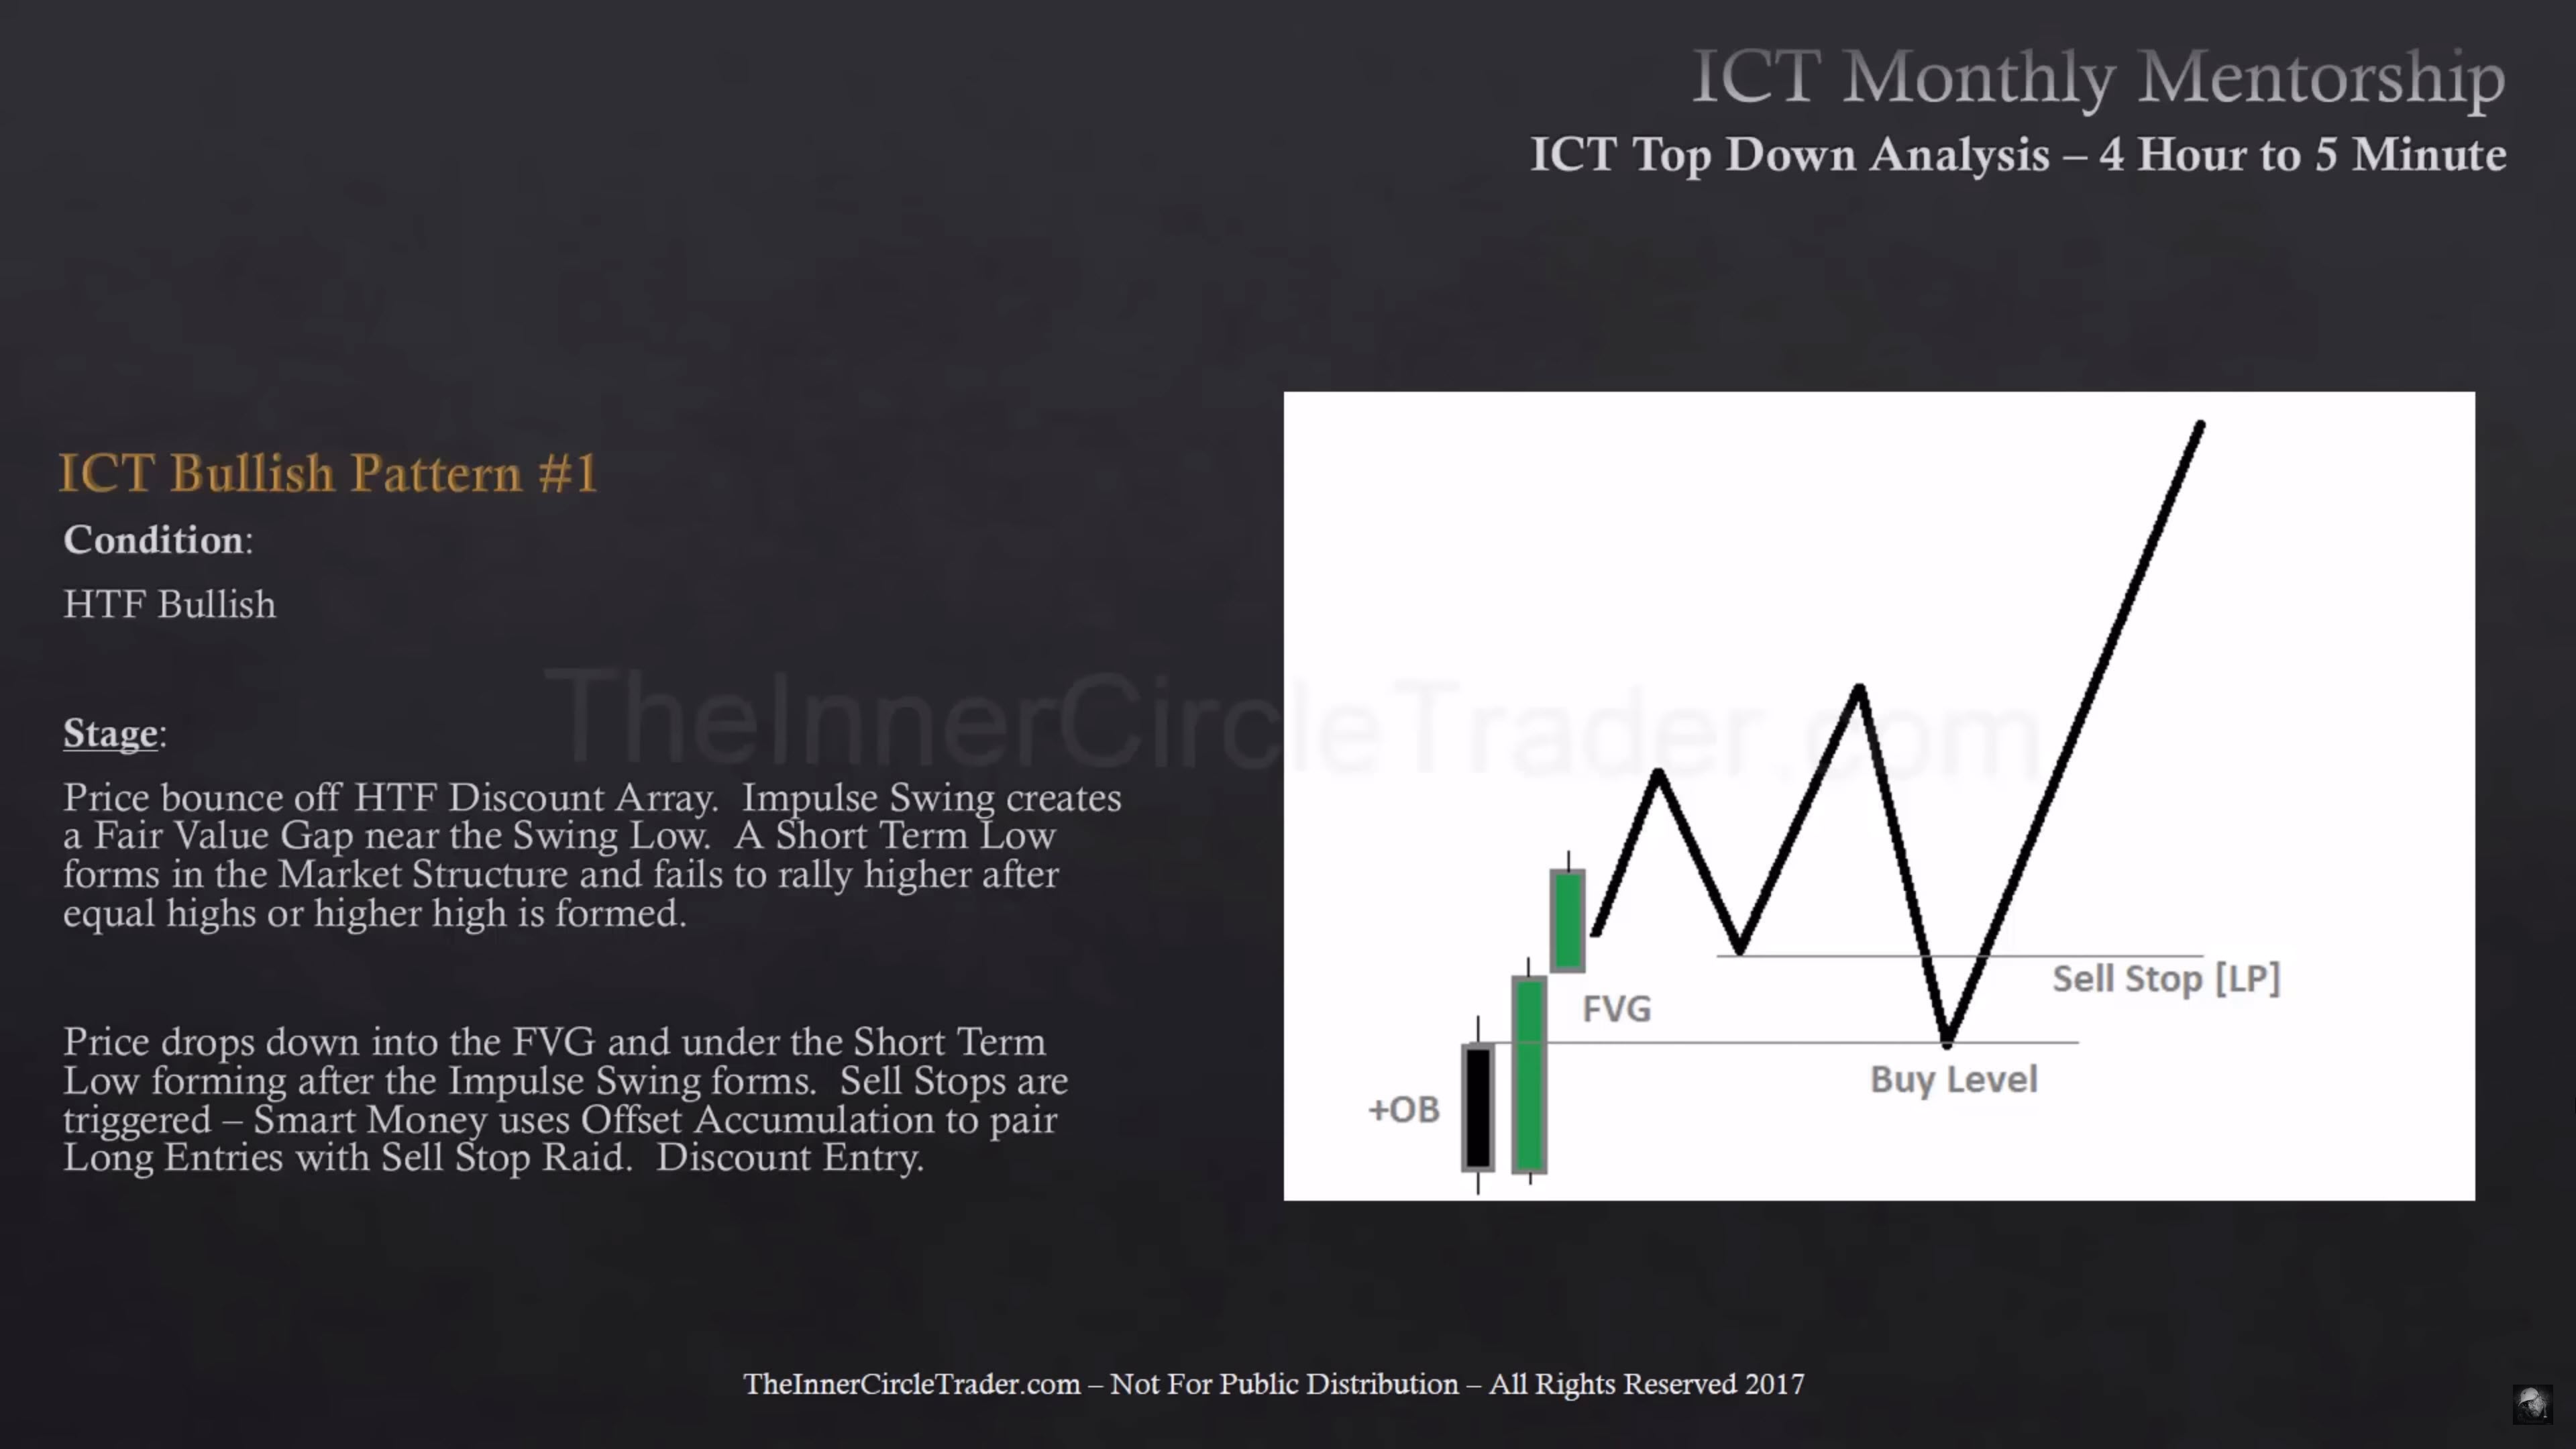
ICT Bullish Pattern #1 - Order Block Entry Setup
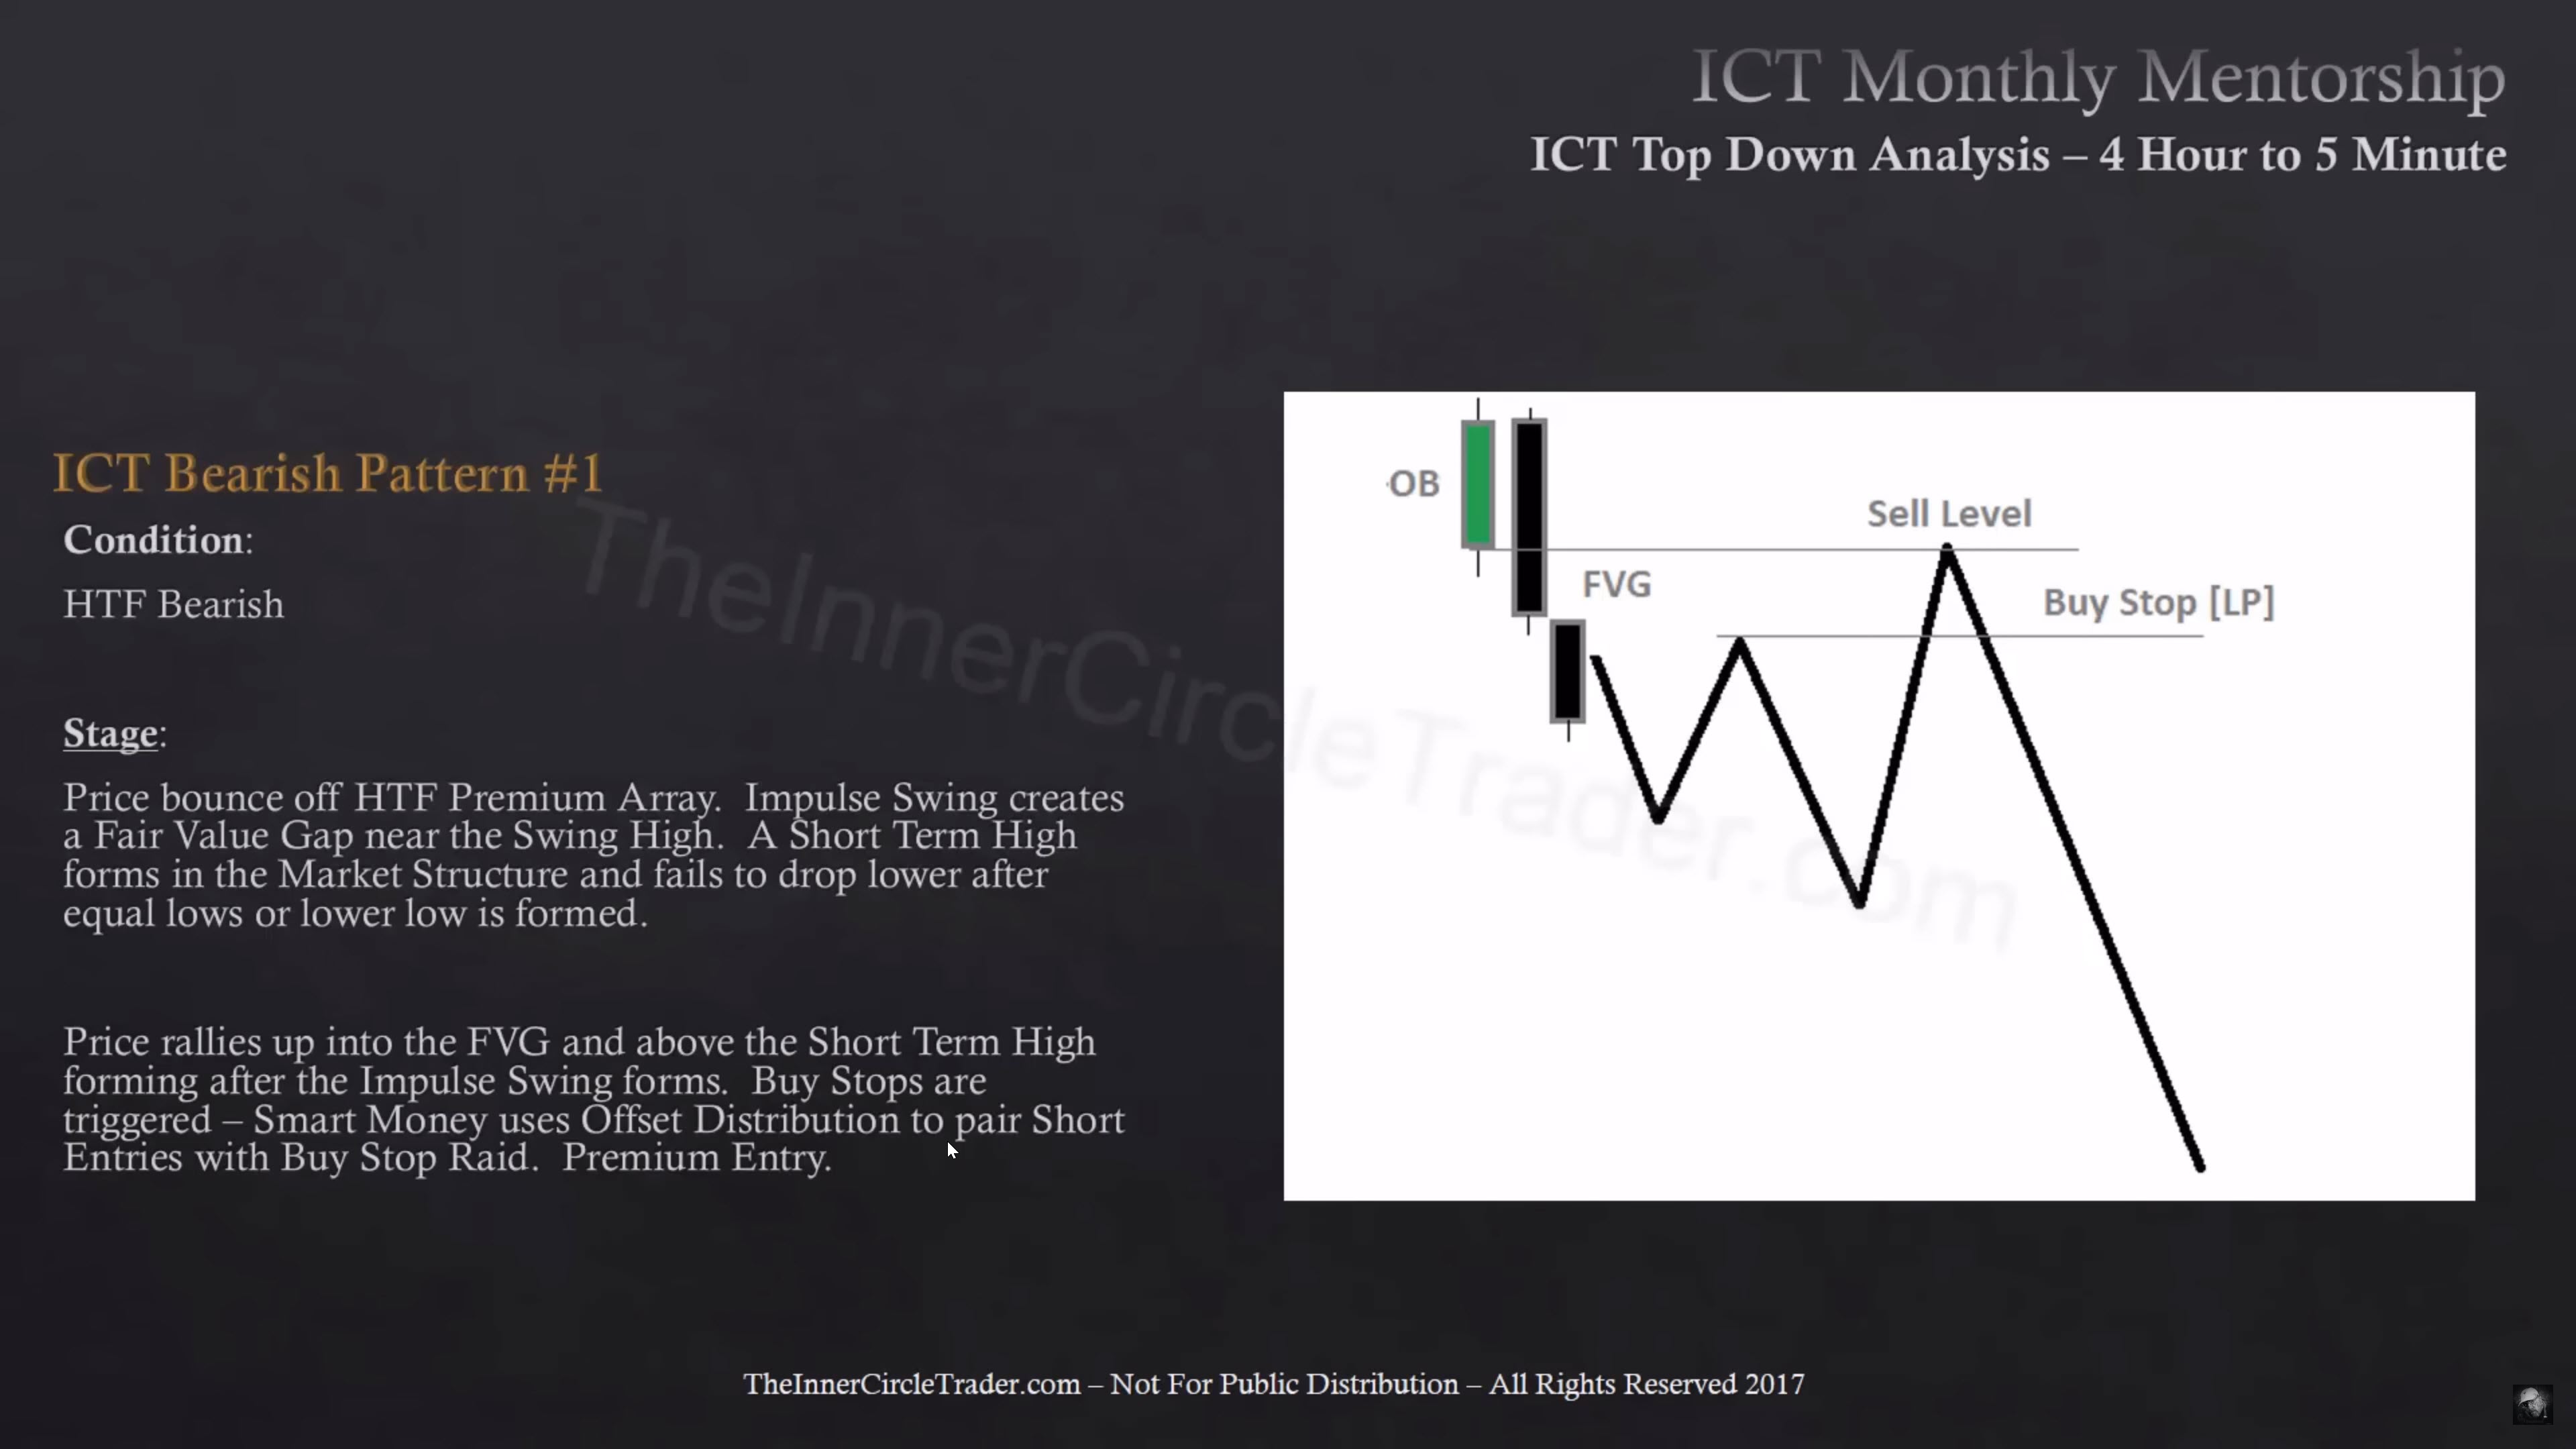
ICT Bearish Pattern #1 - Order Block Entry Setup
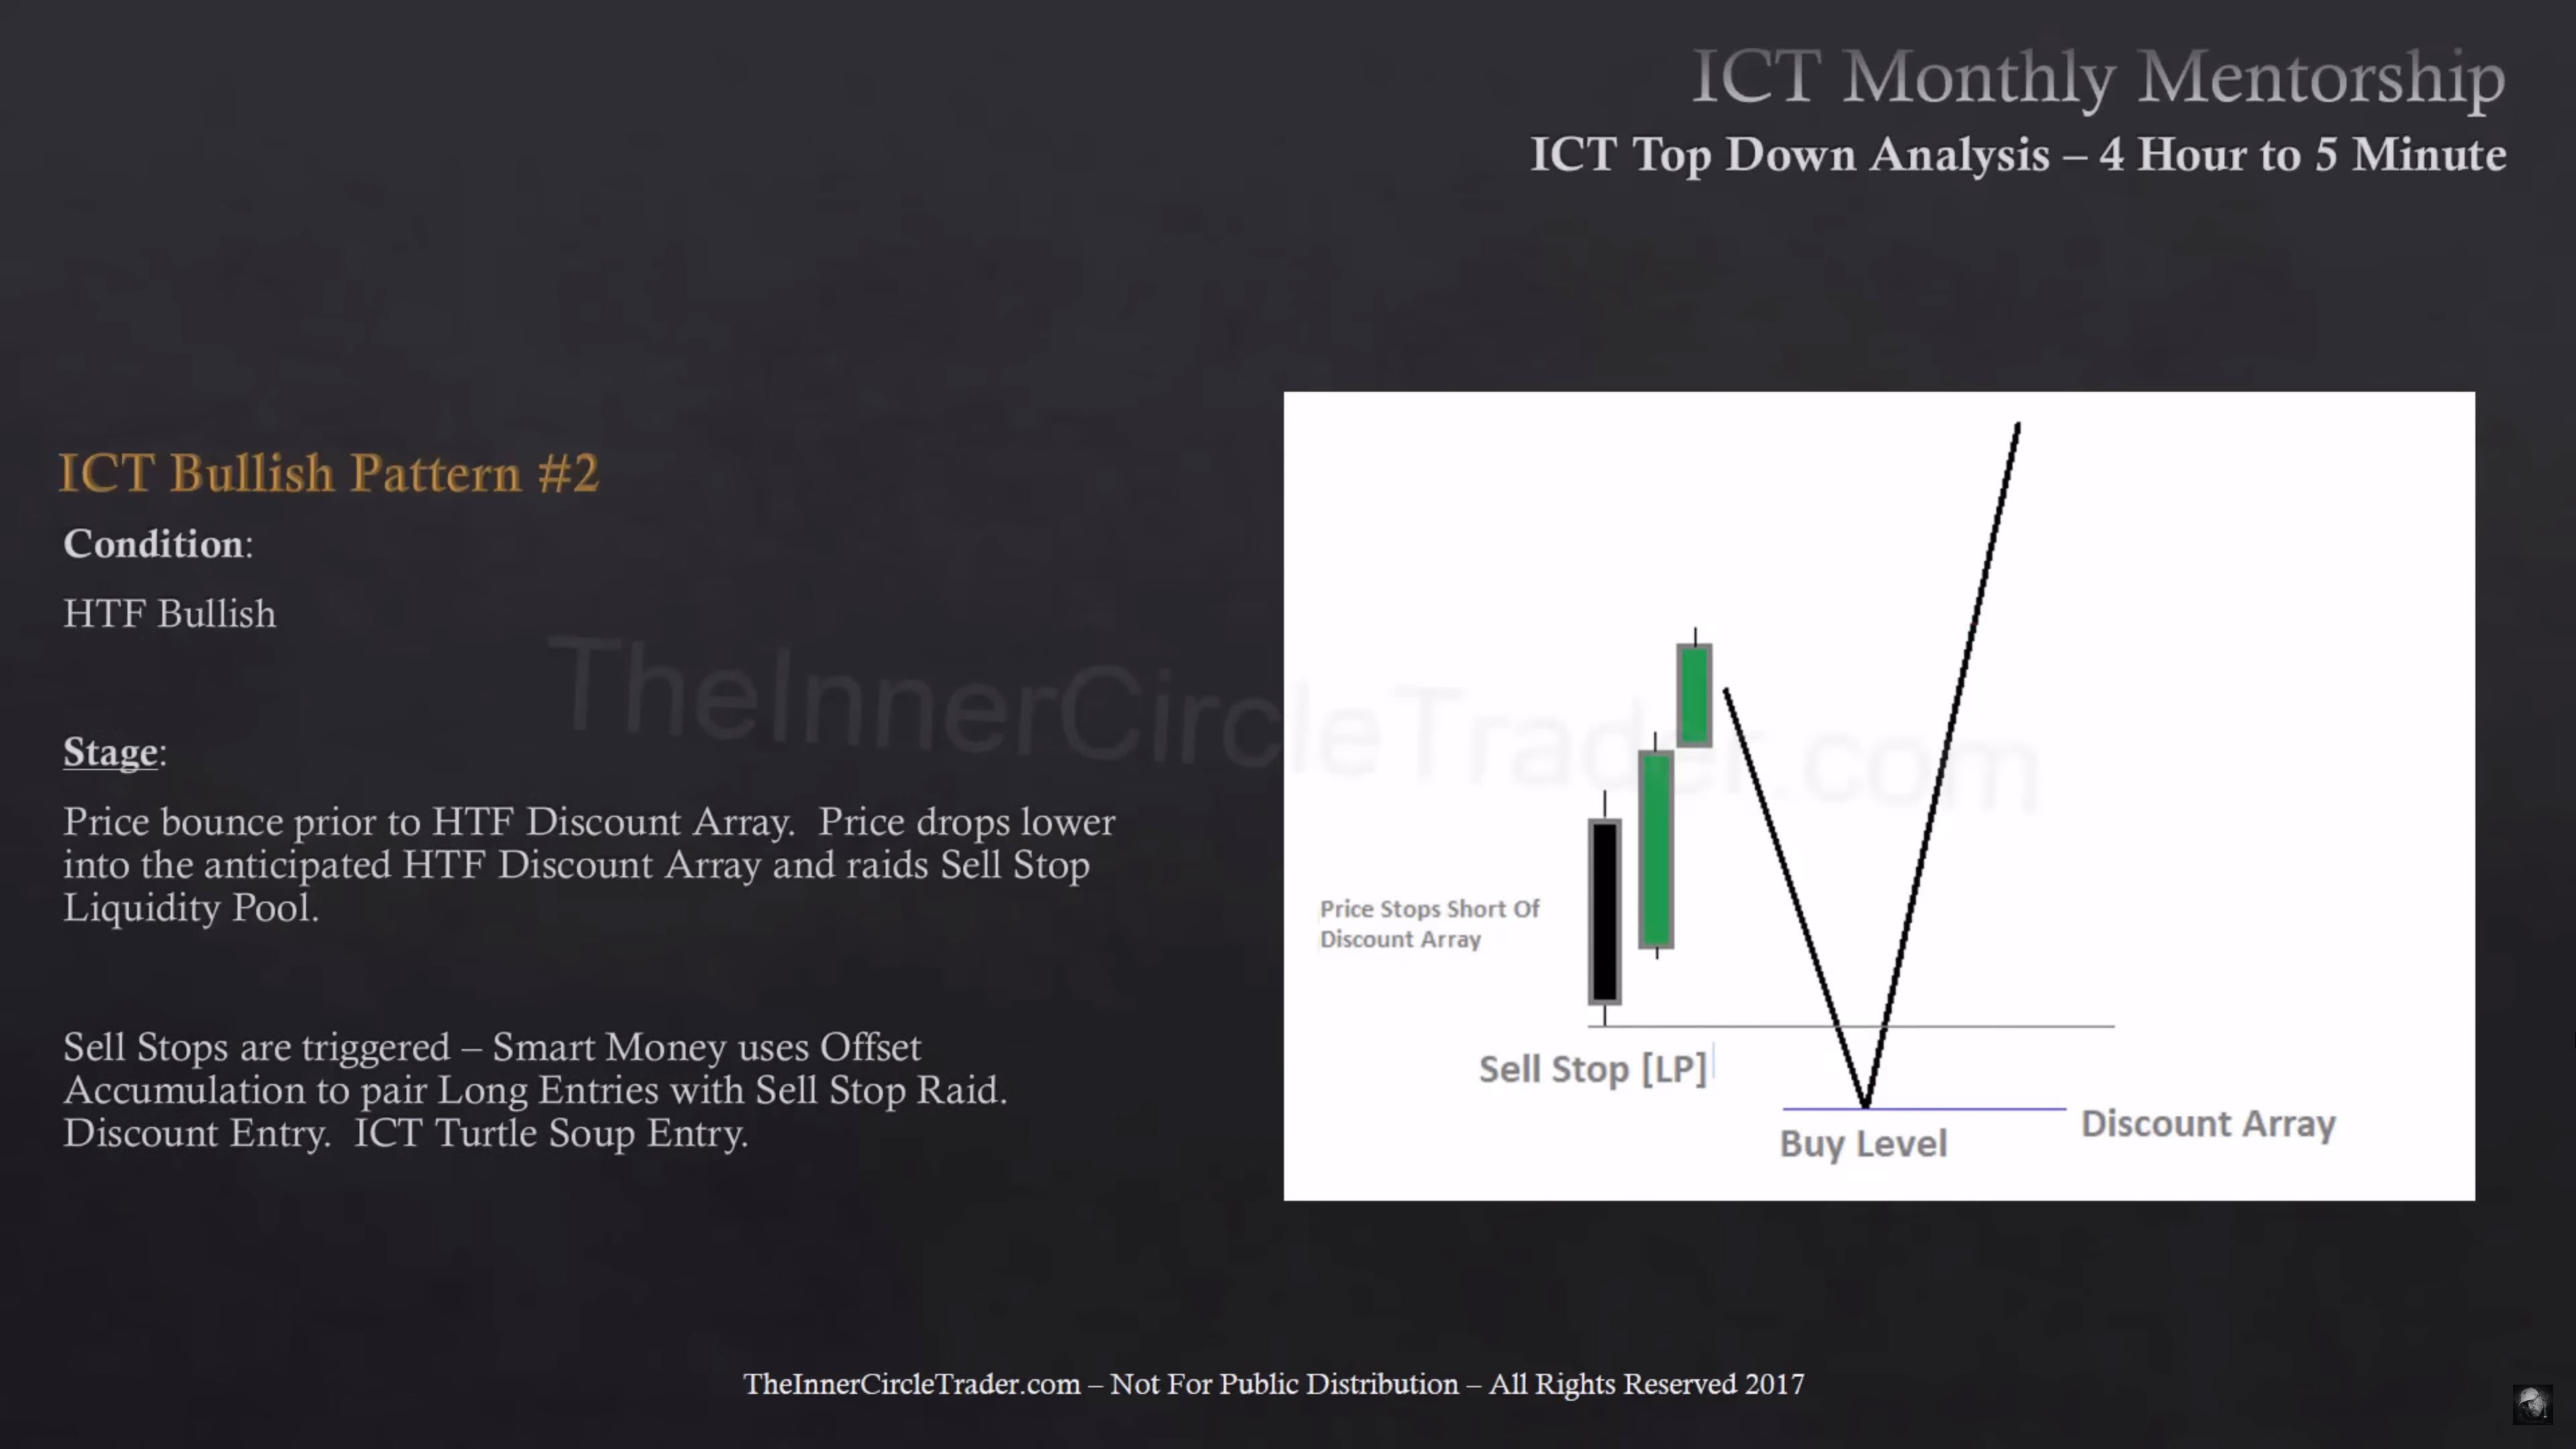
ICT Bullish Pattern #2 - Turtle Soup Entry Setup
ICT Bearish Pattern #2 - Turtle Soup Entry Setup

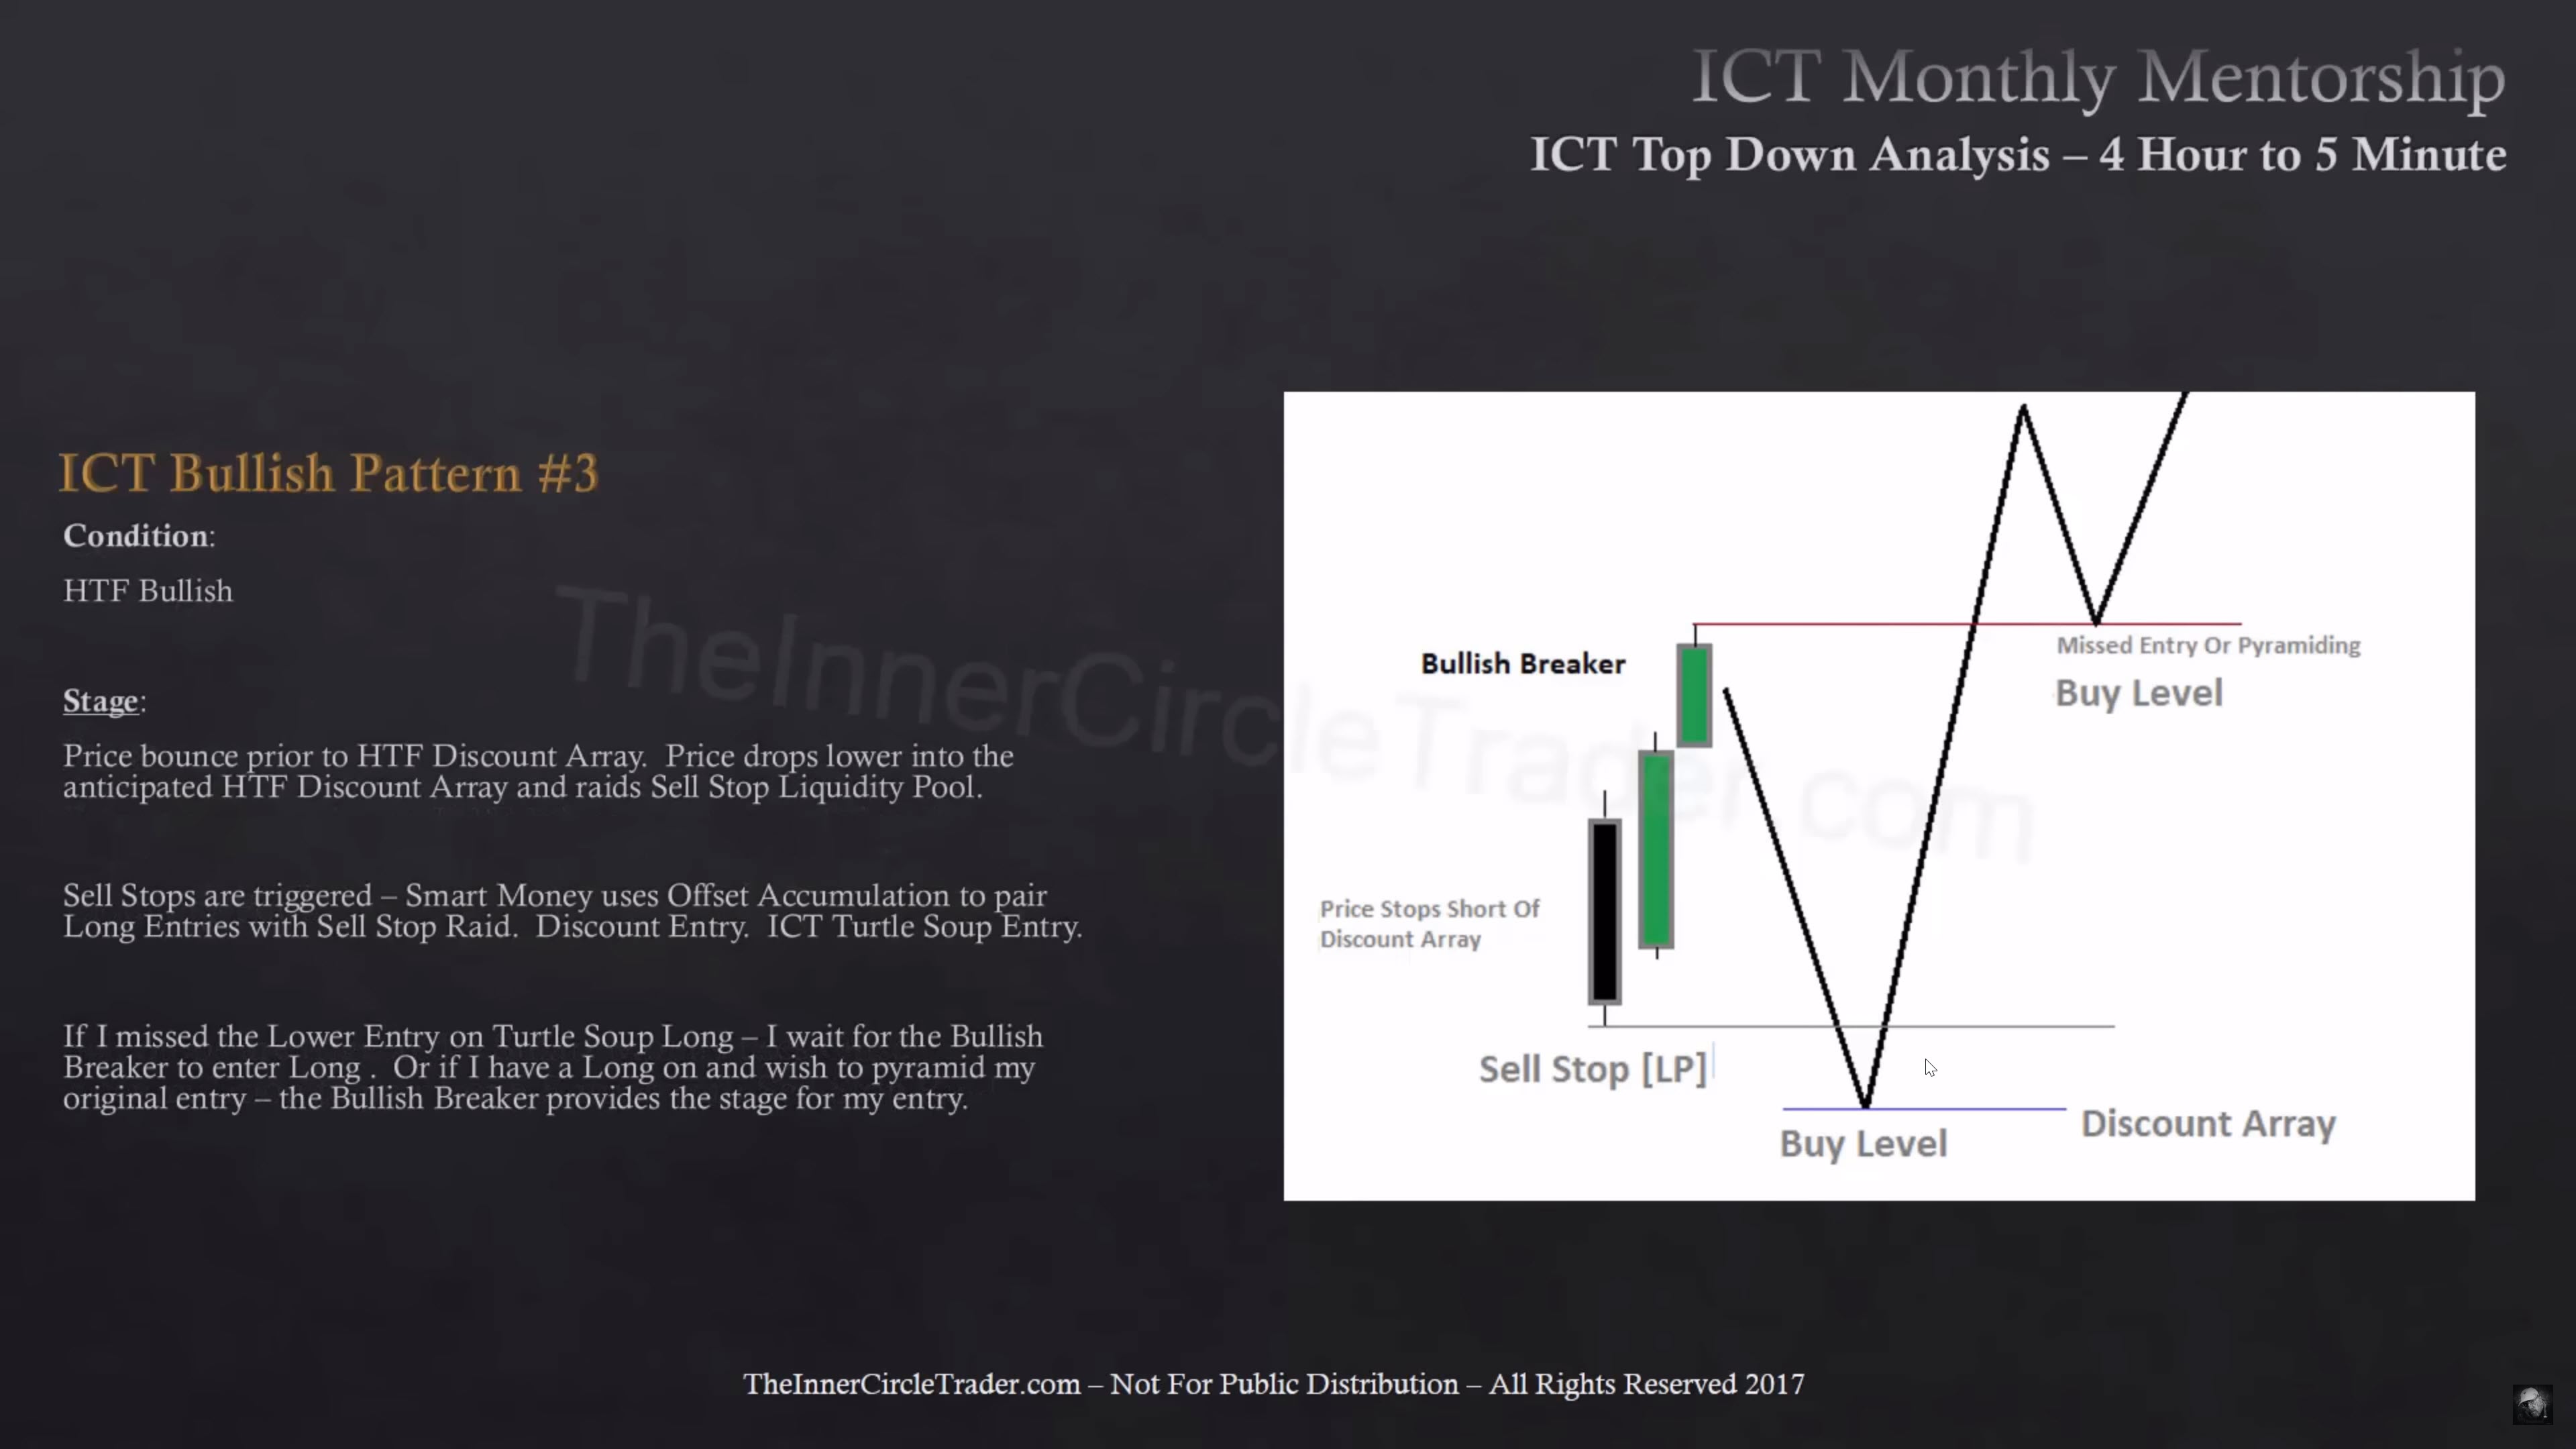
ICT Bullish Pattern #3 - Breaker Entry Setup
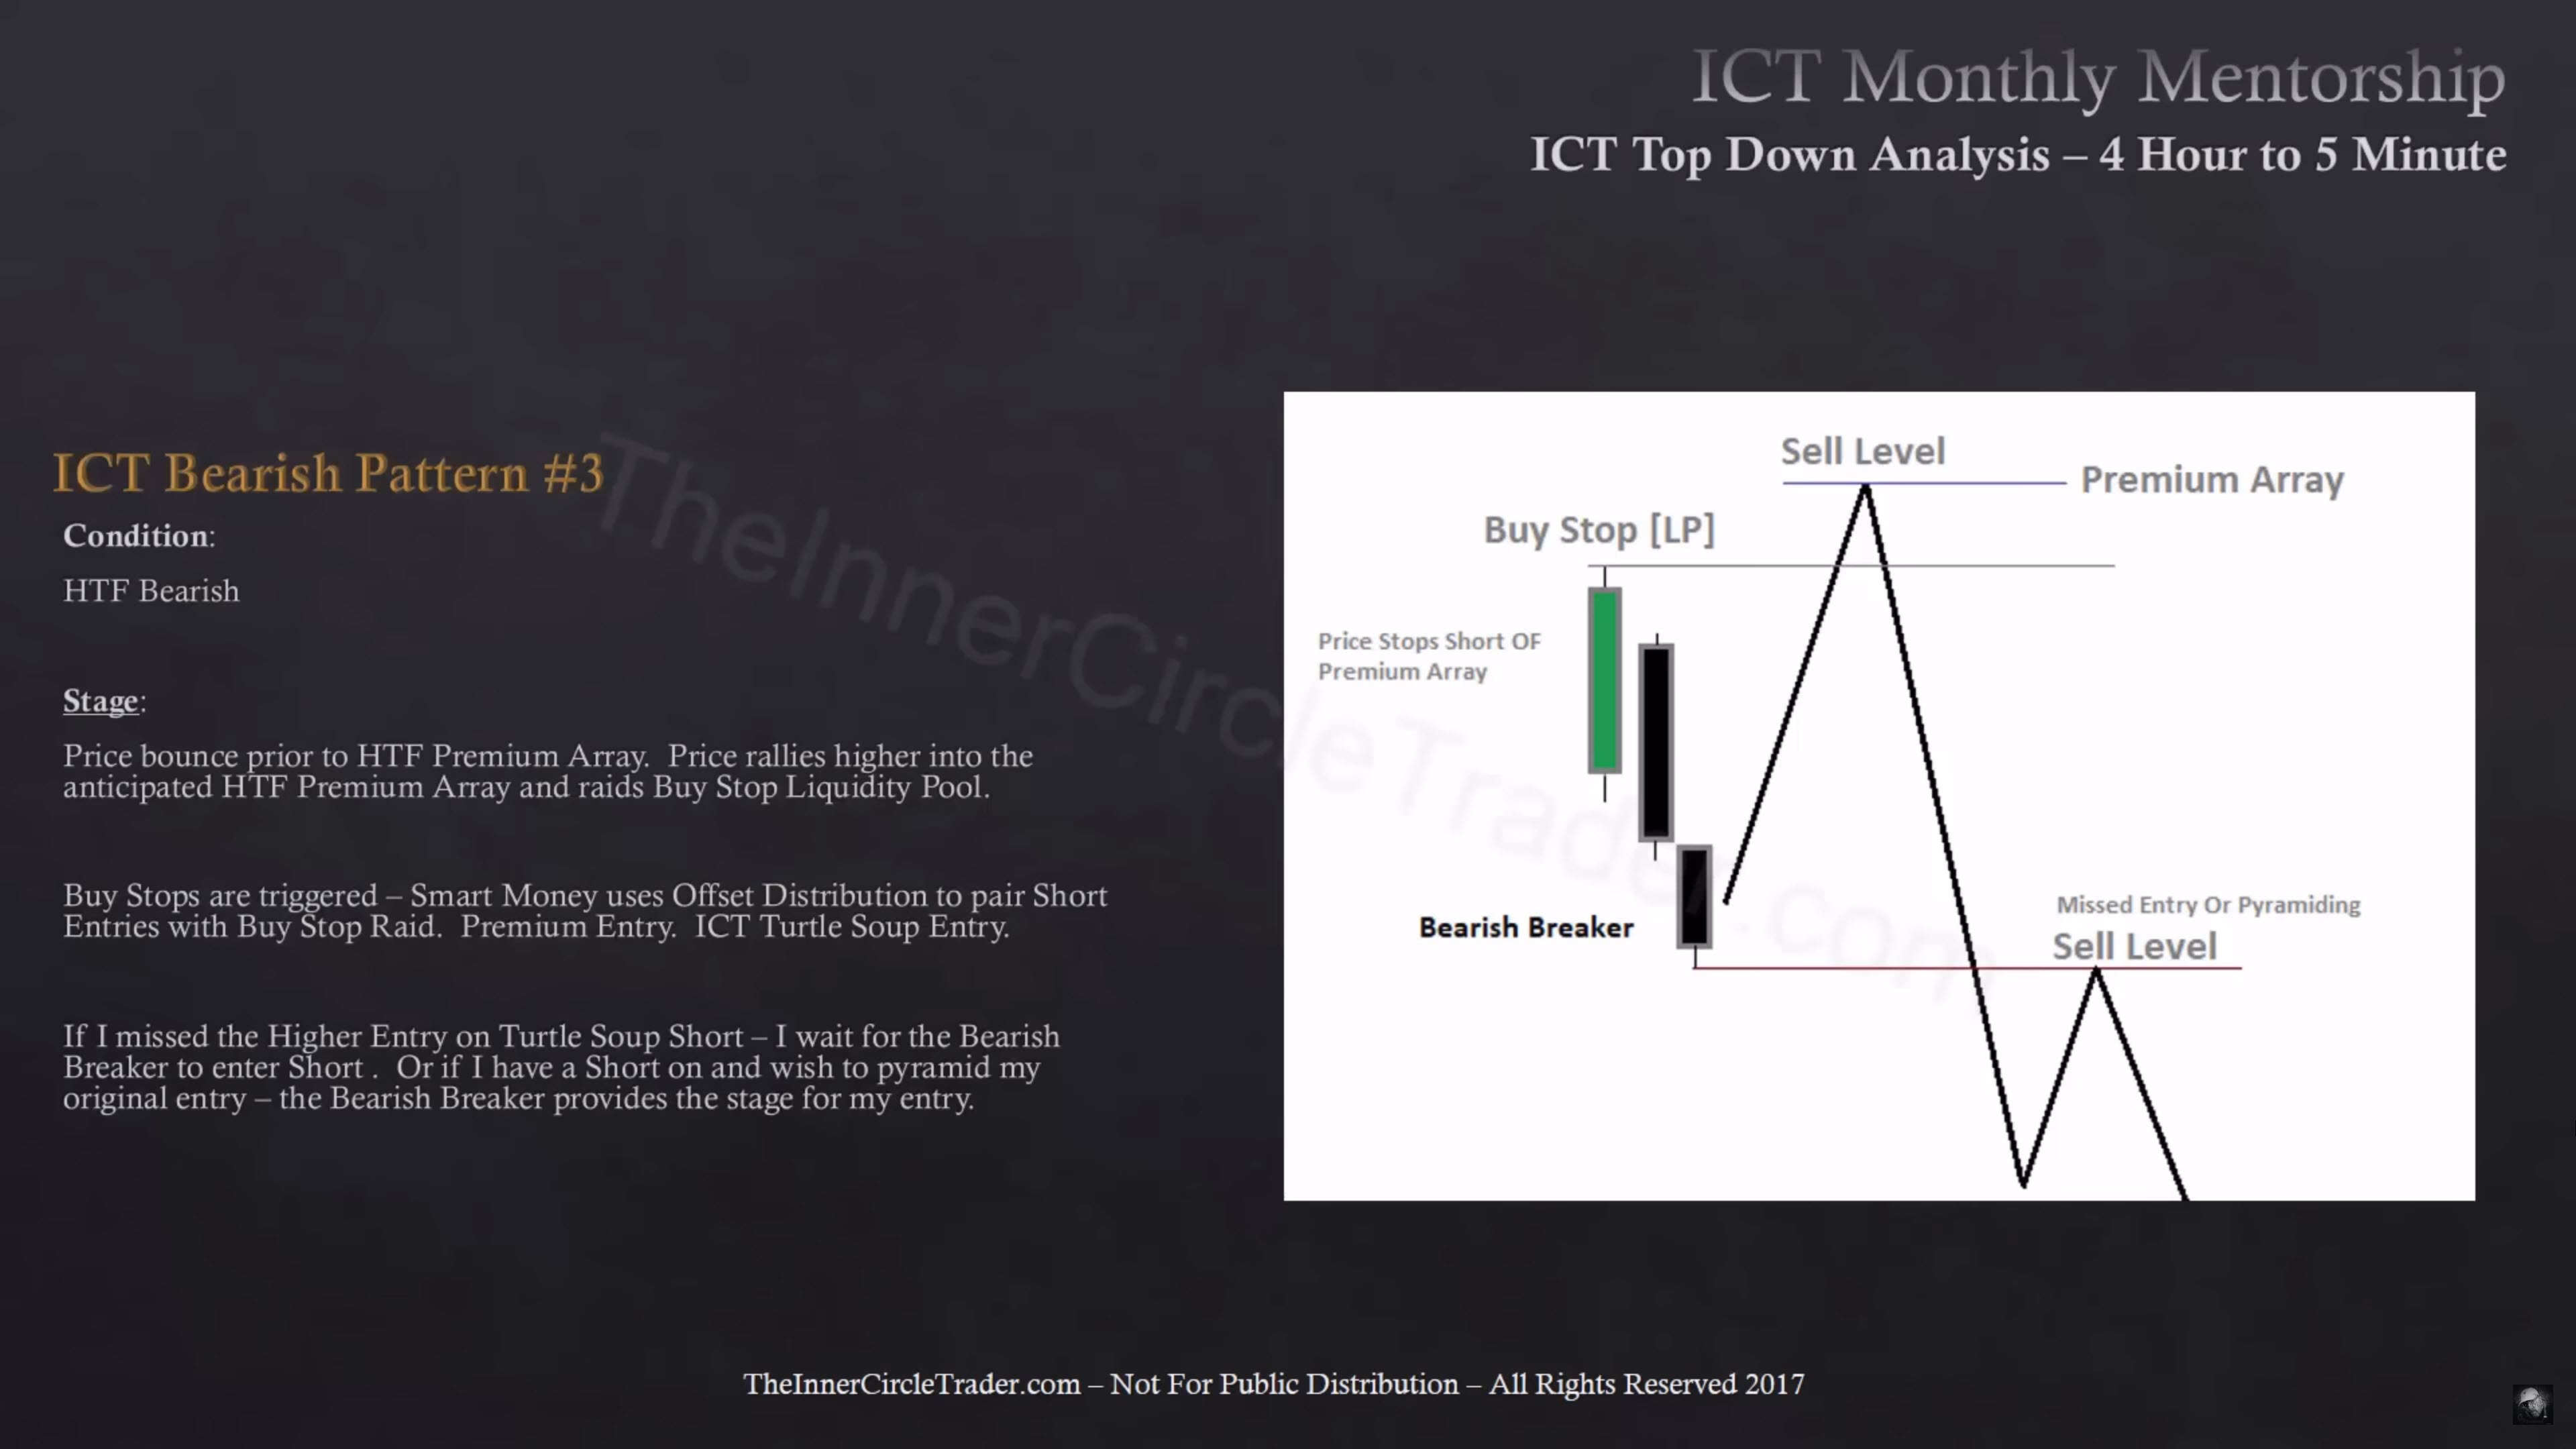
ICT Bearish Pattern #3 - Breaker Entry Setup
Previous lesson: ICT Mentorship Core Content - Month 12 - Short Term Top-Down Analysis