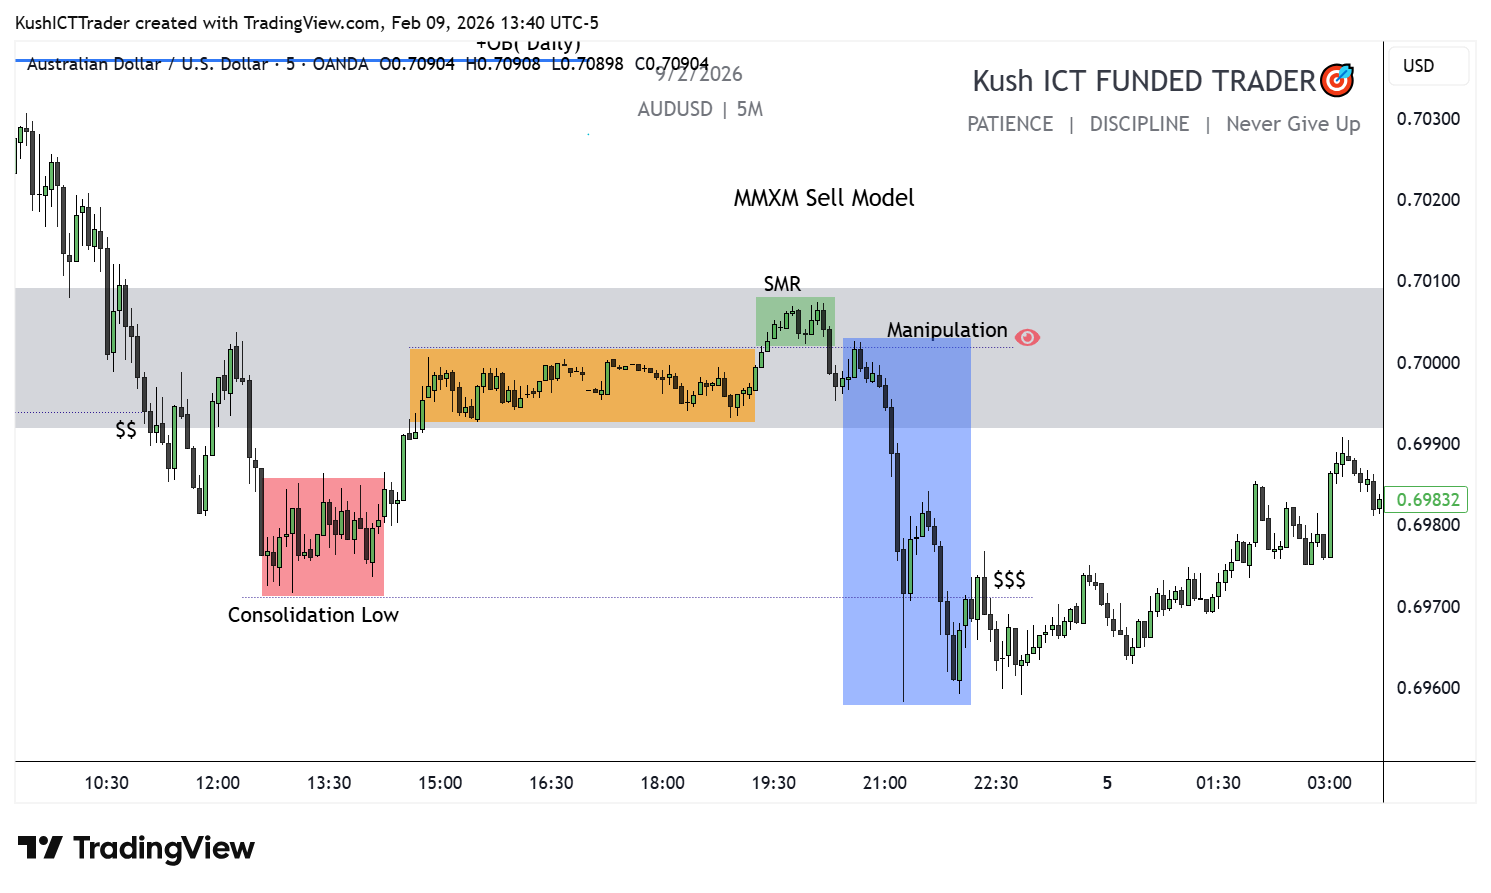
If we’re bearish (MMSM - Market Maker Sell Model), we look for a retracement into a bearish order block or OTE levels.
If we’re bullish (MMBM - Market Maker Buy Model), we look for a retracement into a bullish order block or OTE levels. We can also enter during runs on sell stops (bullish turtle soup entry).
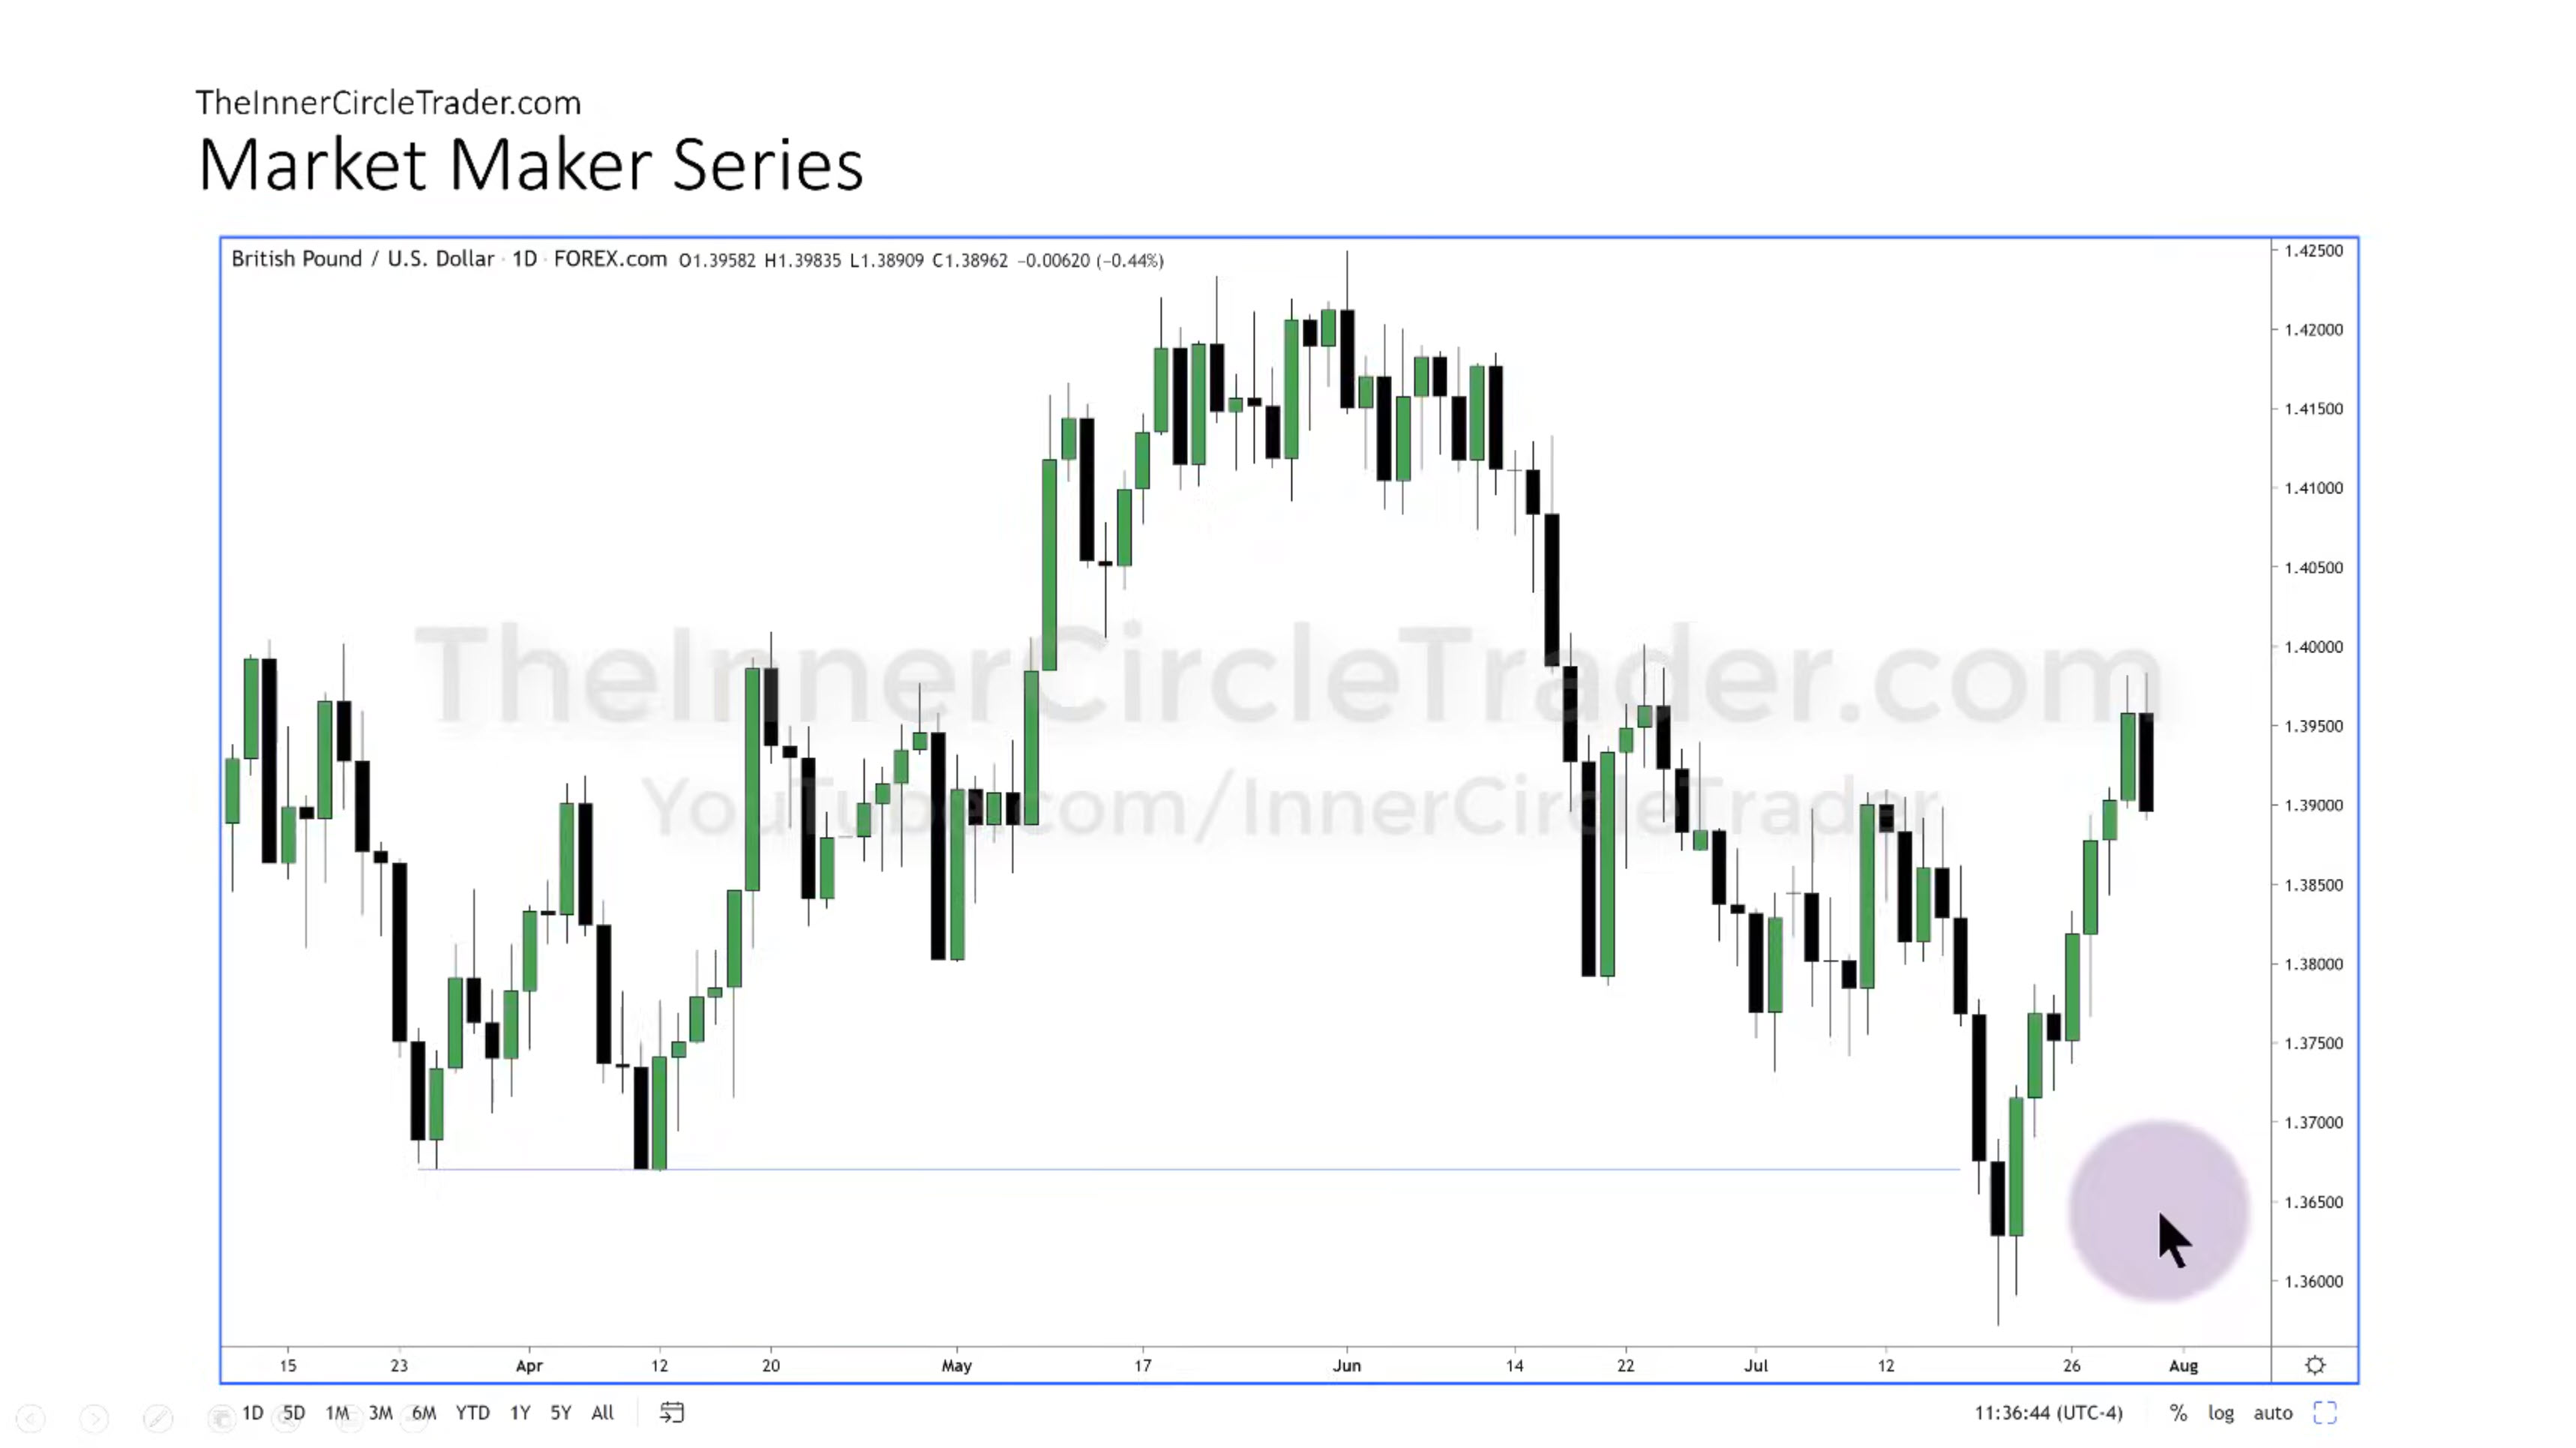
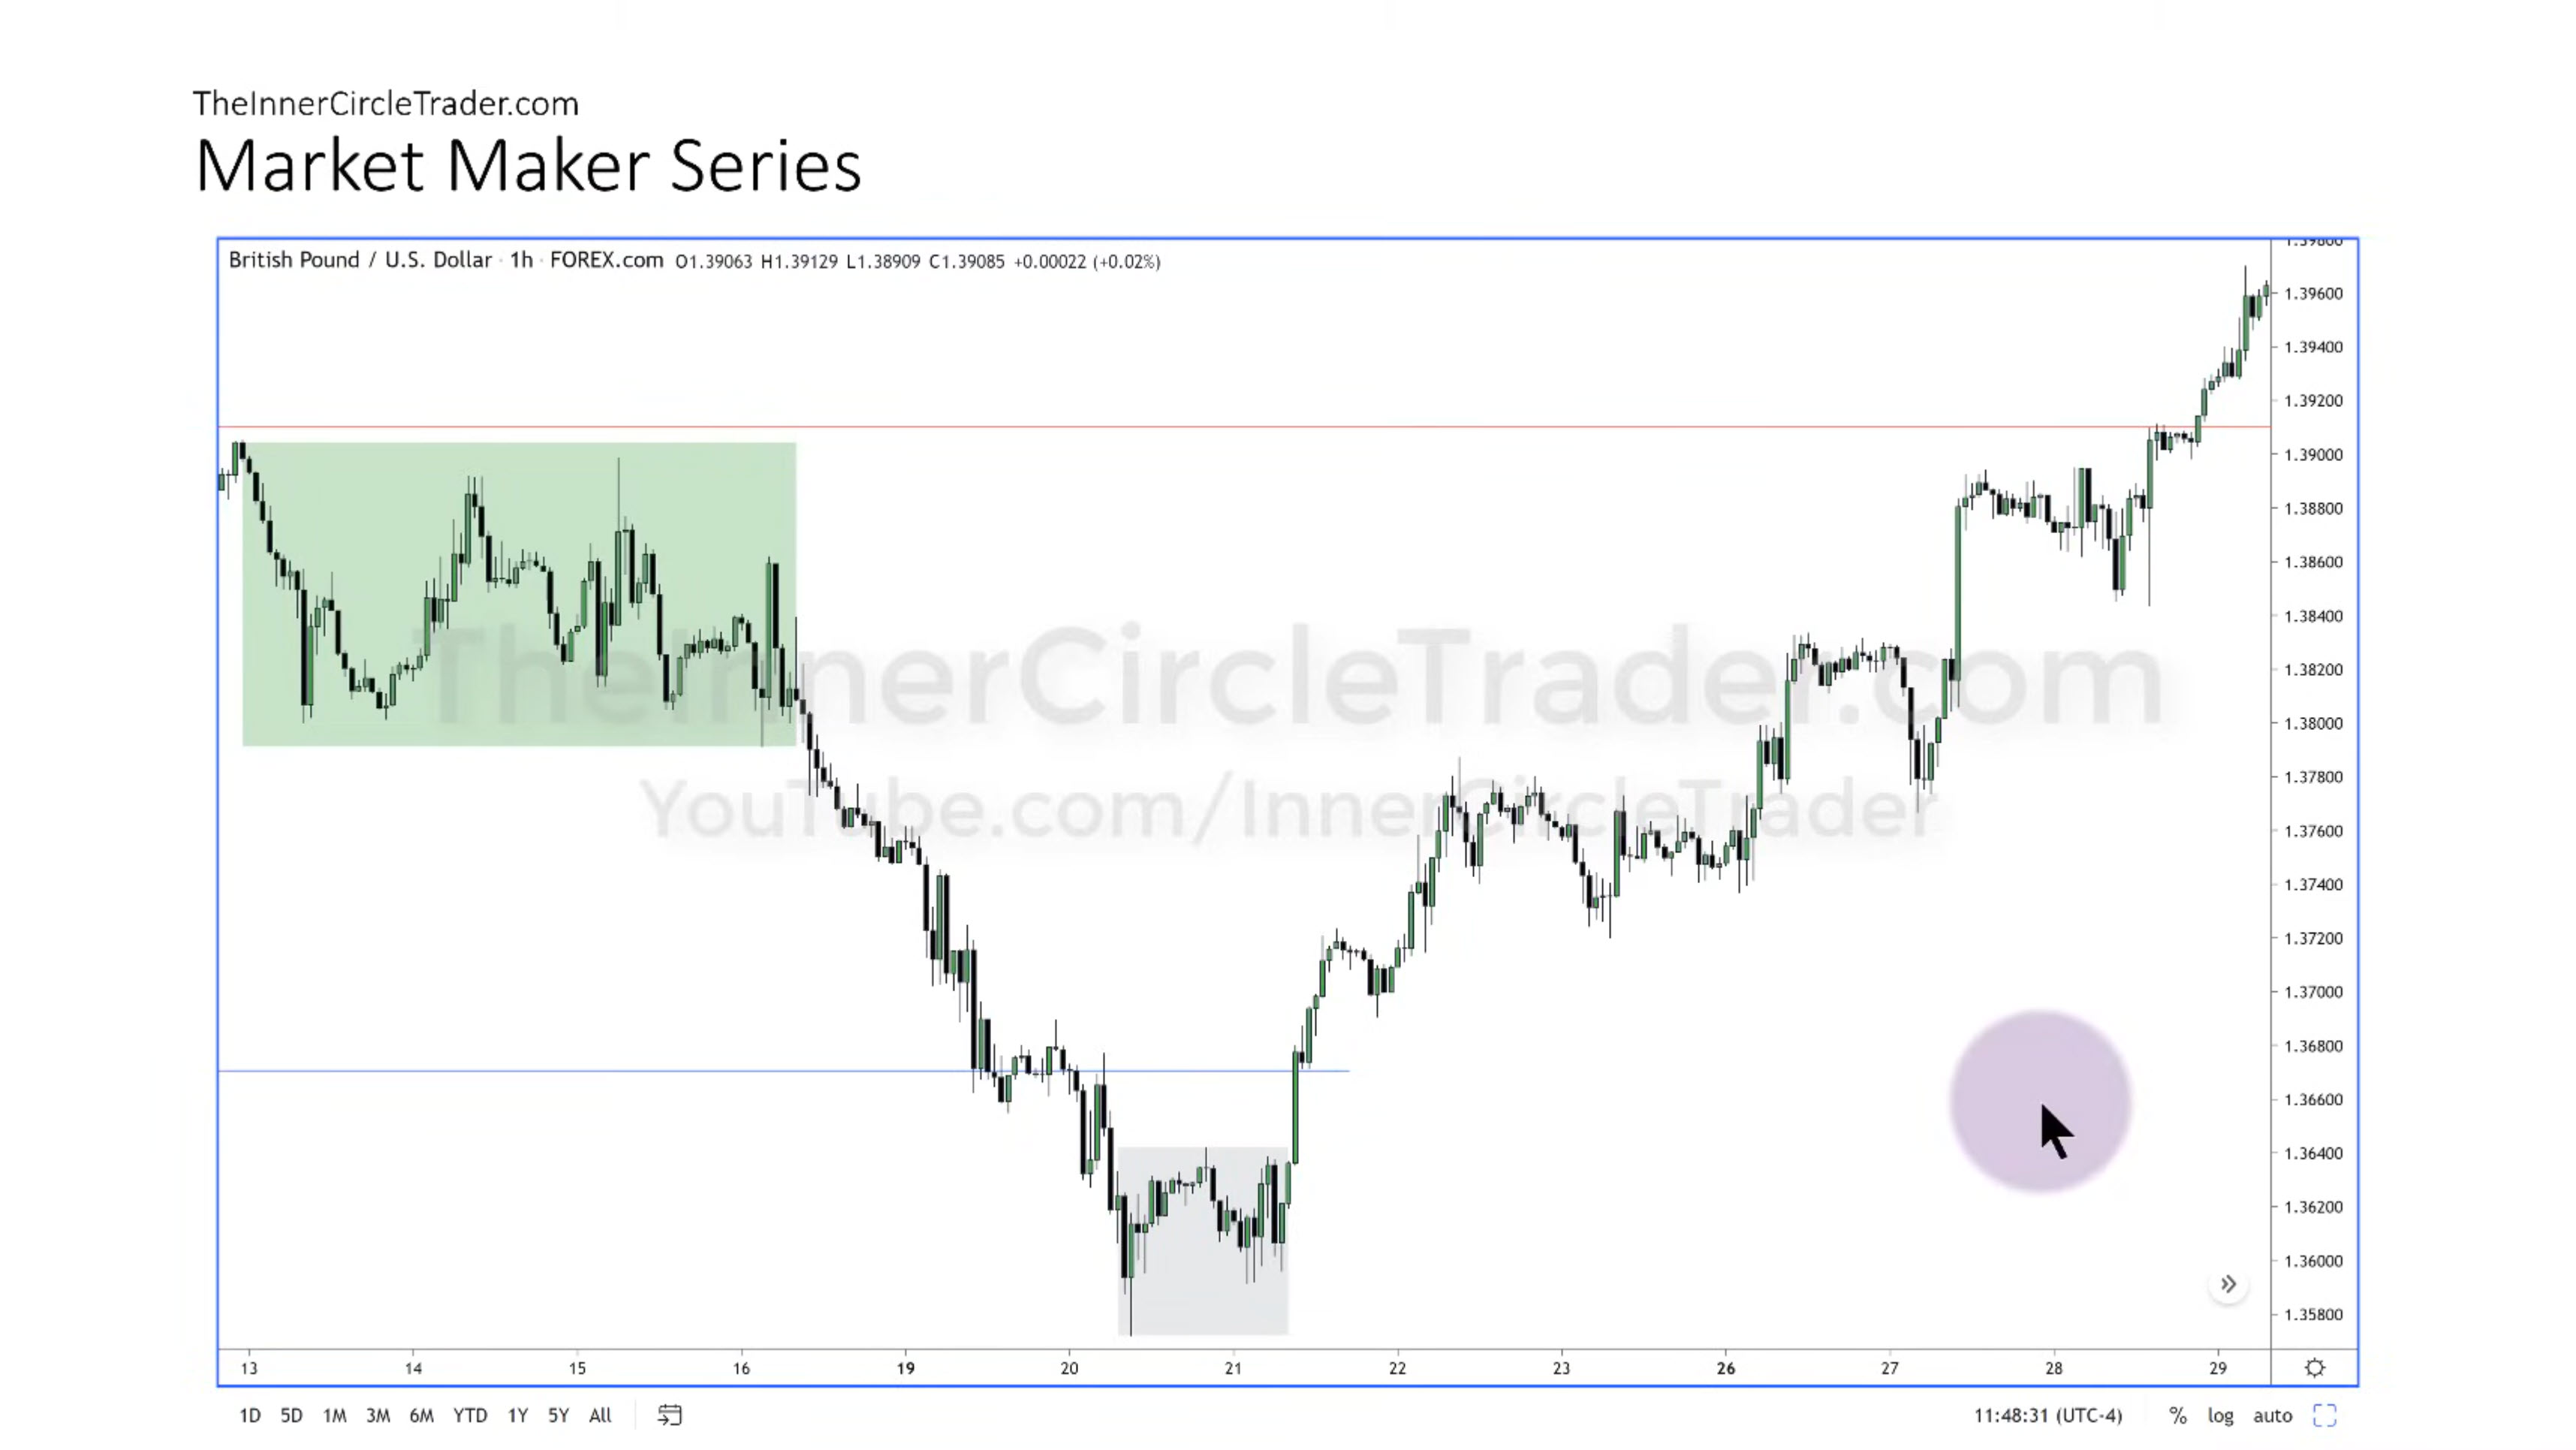
Consolidation is an area where the price stays within a range for a prolonged period, indicating potential upcoming movement. We can also enter during runs on buy stops (bearish turtle soup entry).
We look for a retracement or sharp rejections at consolidation boundaries.
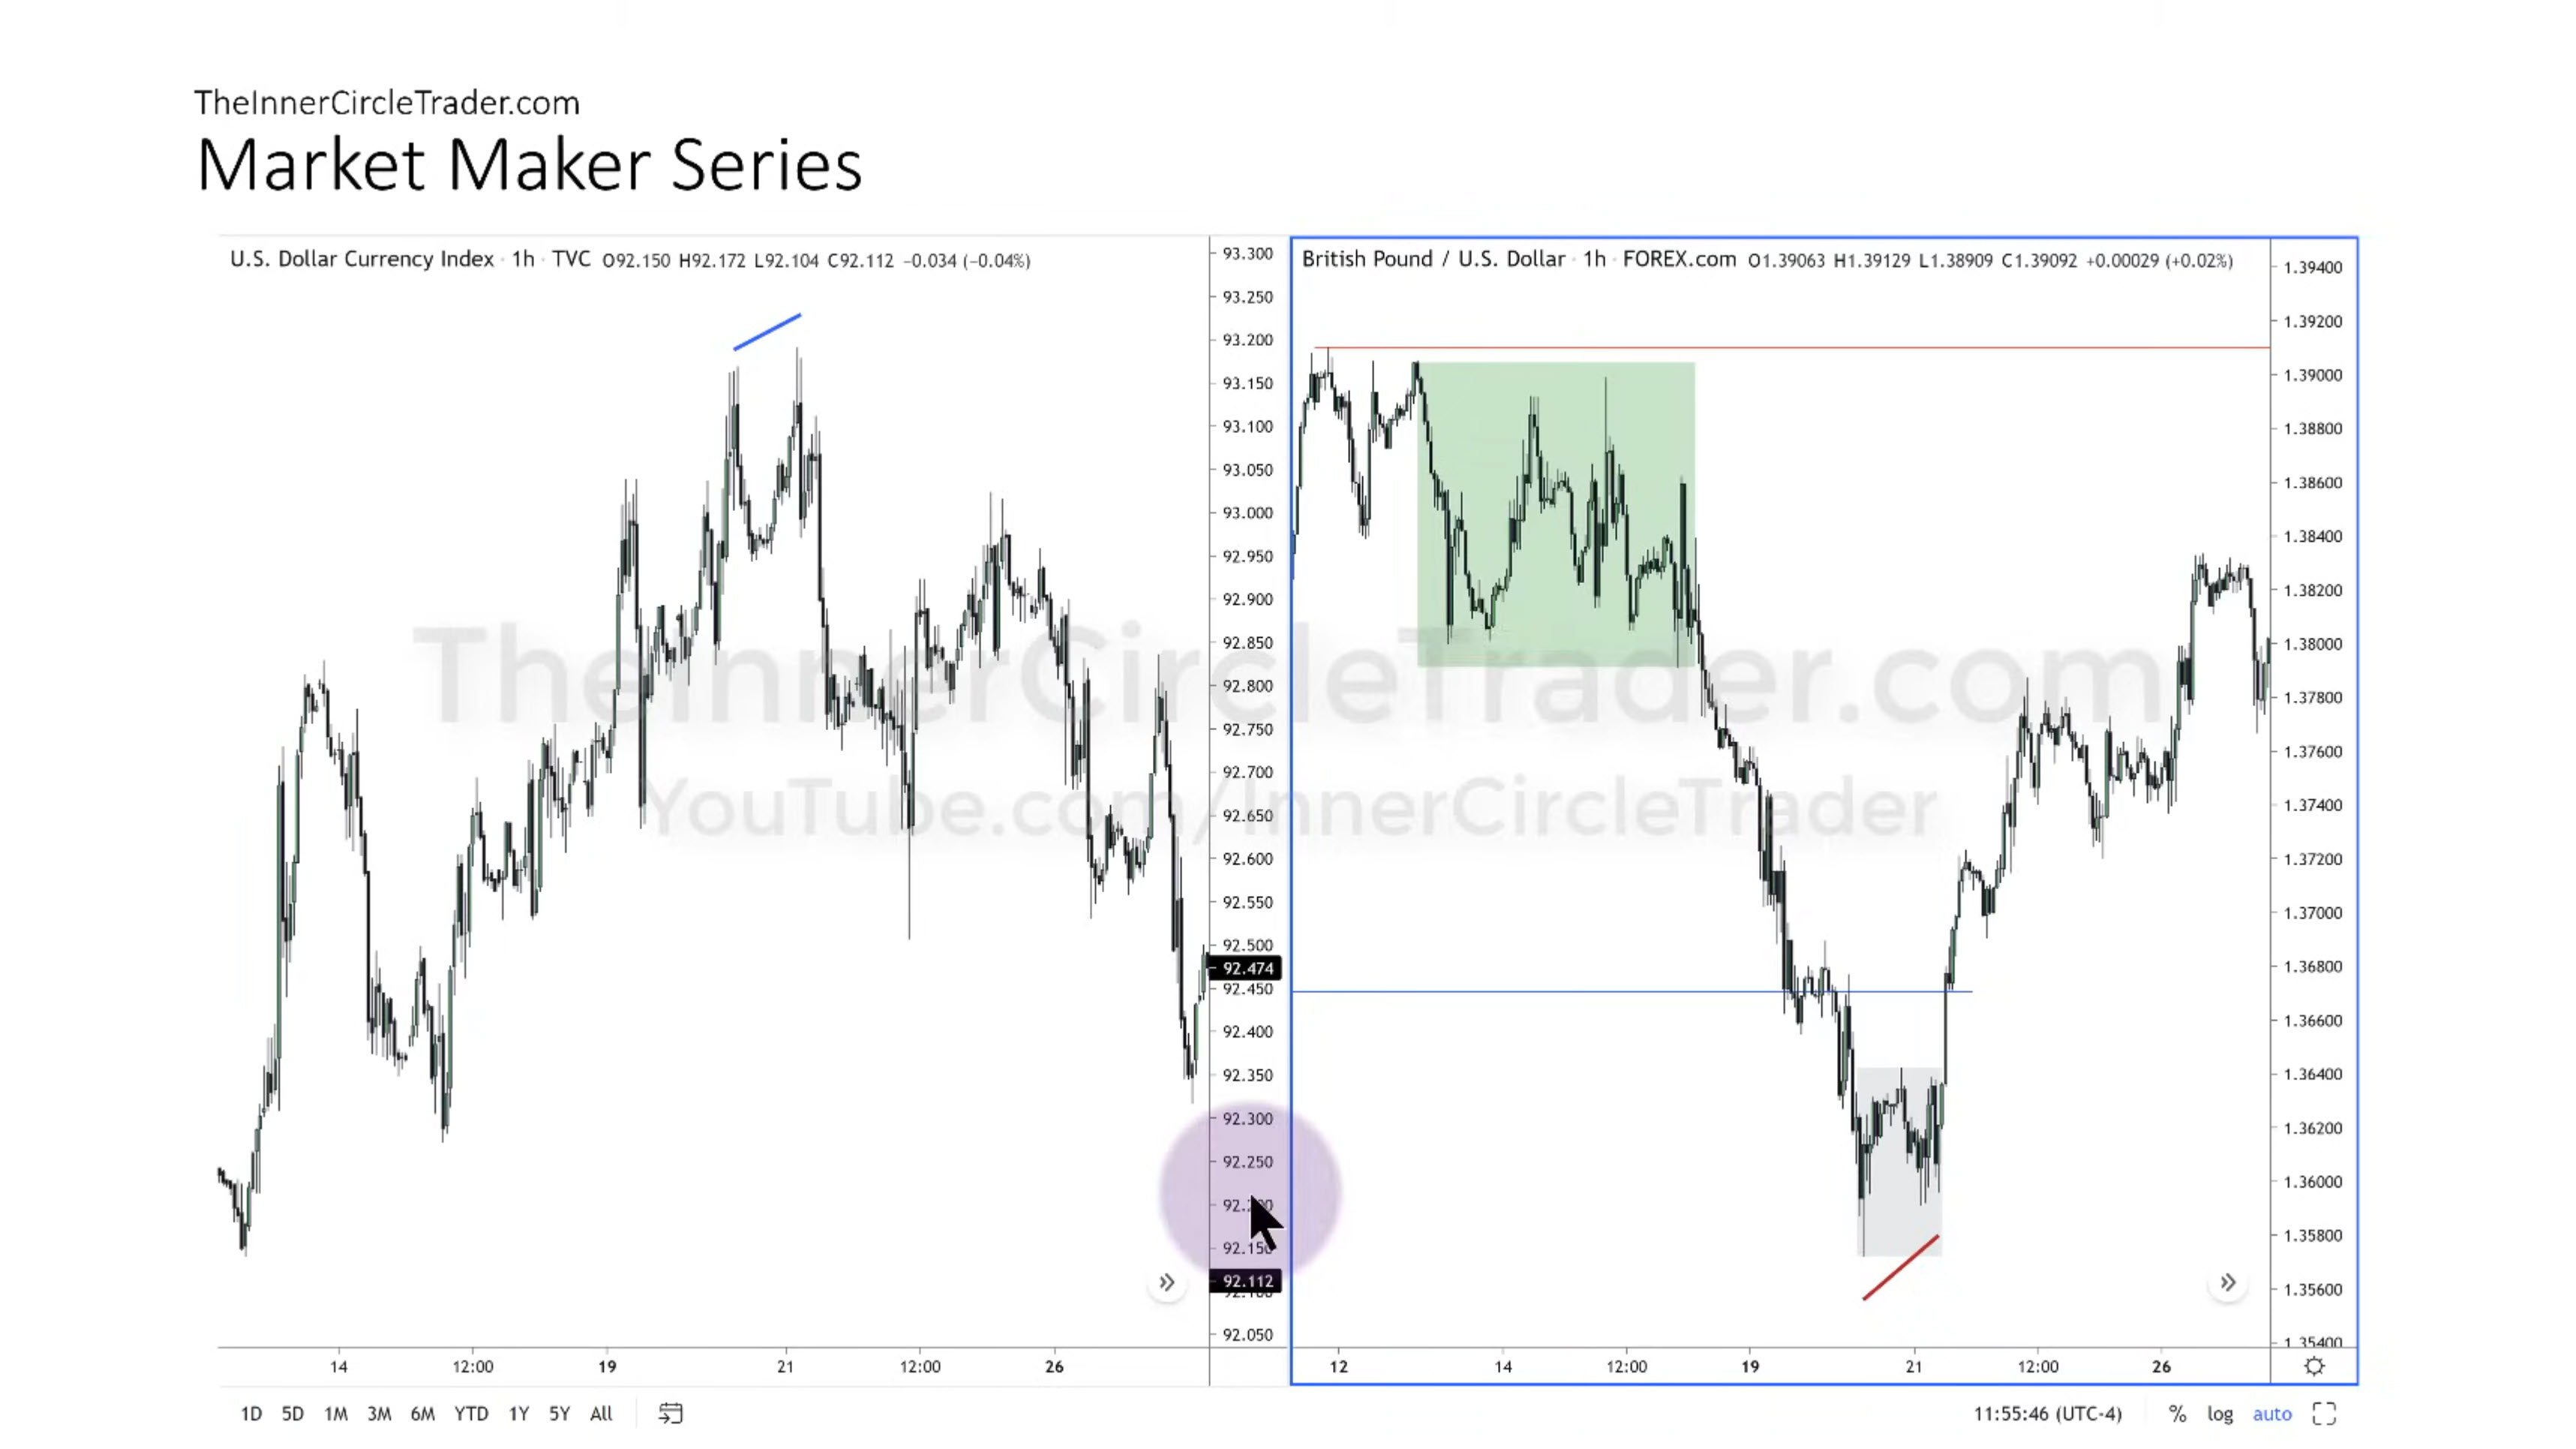
SMT (Smart Money Technique or Smart Money Tool) is a divergence between correlated markets (e.g., EUR/USD vs. GBP/USD).
The Smart Money Technique indicates a strong disparity and possible market reversal. For example, if EUR/USD makes a higher low while GBP/USD makes a lower low, it suggests a divergence and potential reversal.
Experience and continuous study are essential for mastering these concepts and applying them in live trading.
I need to ask you something, brother, please help me with this. I don’t really understand how to actually use the MMXM model as shown in this video from ICT. Please explain it to me. I can look at the MMXM model, but I’m confused about how to look at the model in the structure, as I imagined that I should have an HTF for bias and a time frame for the structure and a time frame for entry, the entry time frame that I need to look for MM. XM to form a formation. If no formation forms, I won’t make a trade?
Is that all I need to look for?
Or do I need to say something else, such as that I need some guidance from you?
For example, I choose an overview of an ICT playlist to get started, to learn ICT as a structural form so that I’m not so overwhelmed, so I actually proceed as follows
The uncertainty in this case was that when I learn a concept, I practice it afterwards to understand it, but when I try to apply the concepts live, some of my ICT trader friends say they only use 2-3 concepts. I’m so confused about how to do this.
Please, Daniel, help me in this case, it would be very helpful for me.
First, don’t complicate it. In fact, trading according to price action is quite simple.
I understand that ICT lessons are often confusing and incomprehensible. Michael did this on purpose to keep our attention and curiosity for as long as possible.
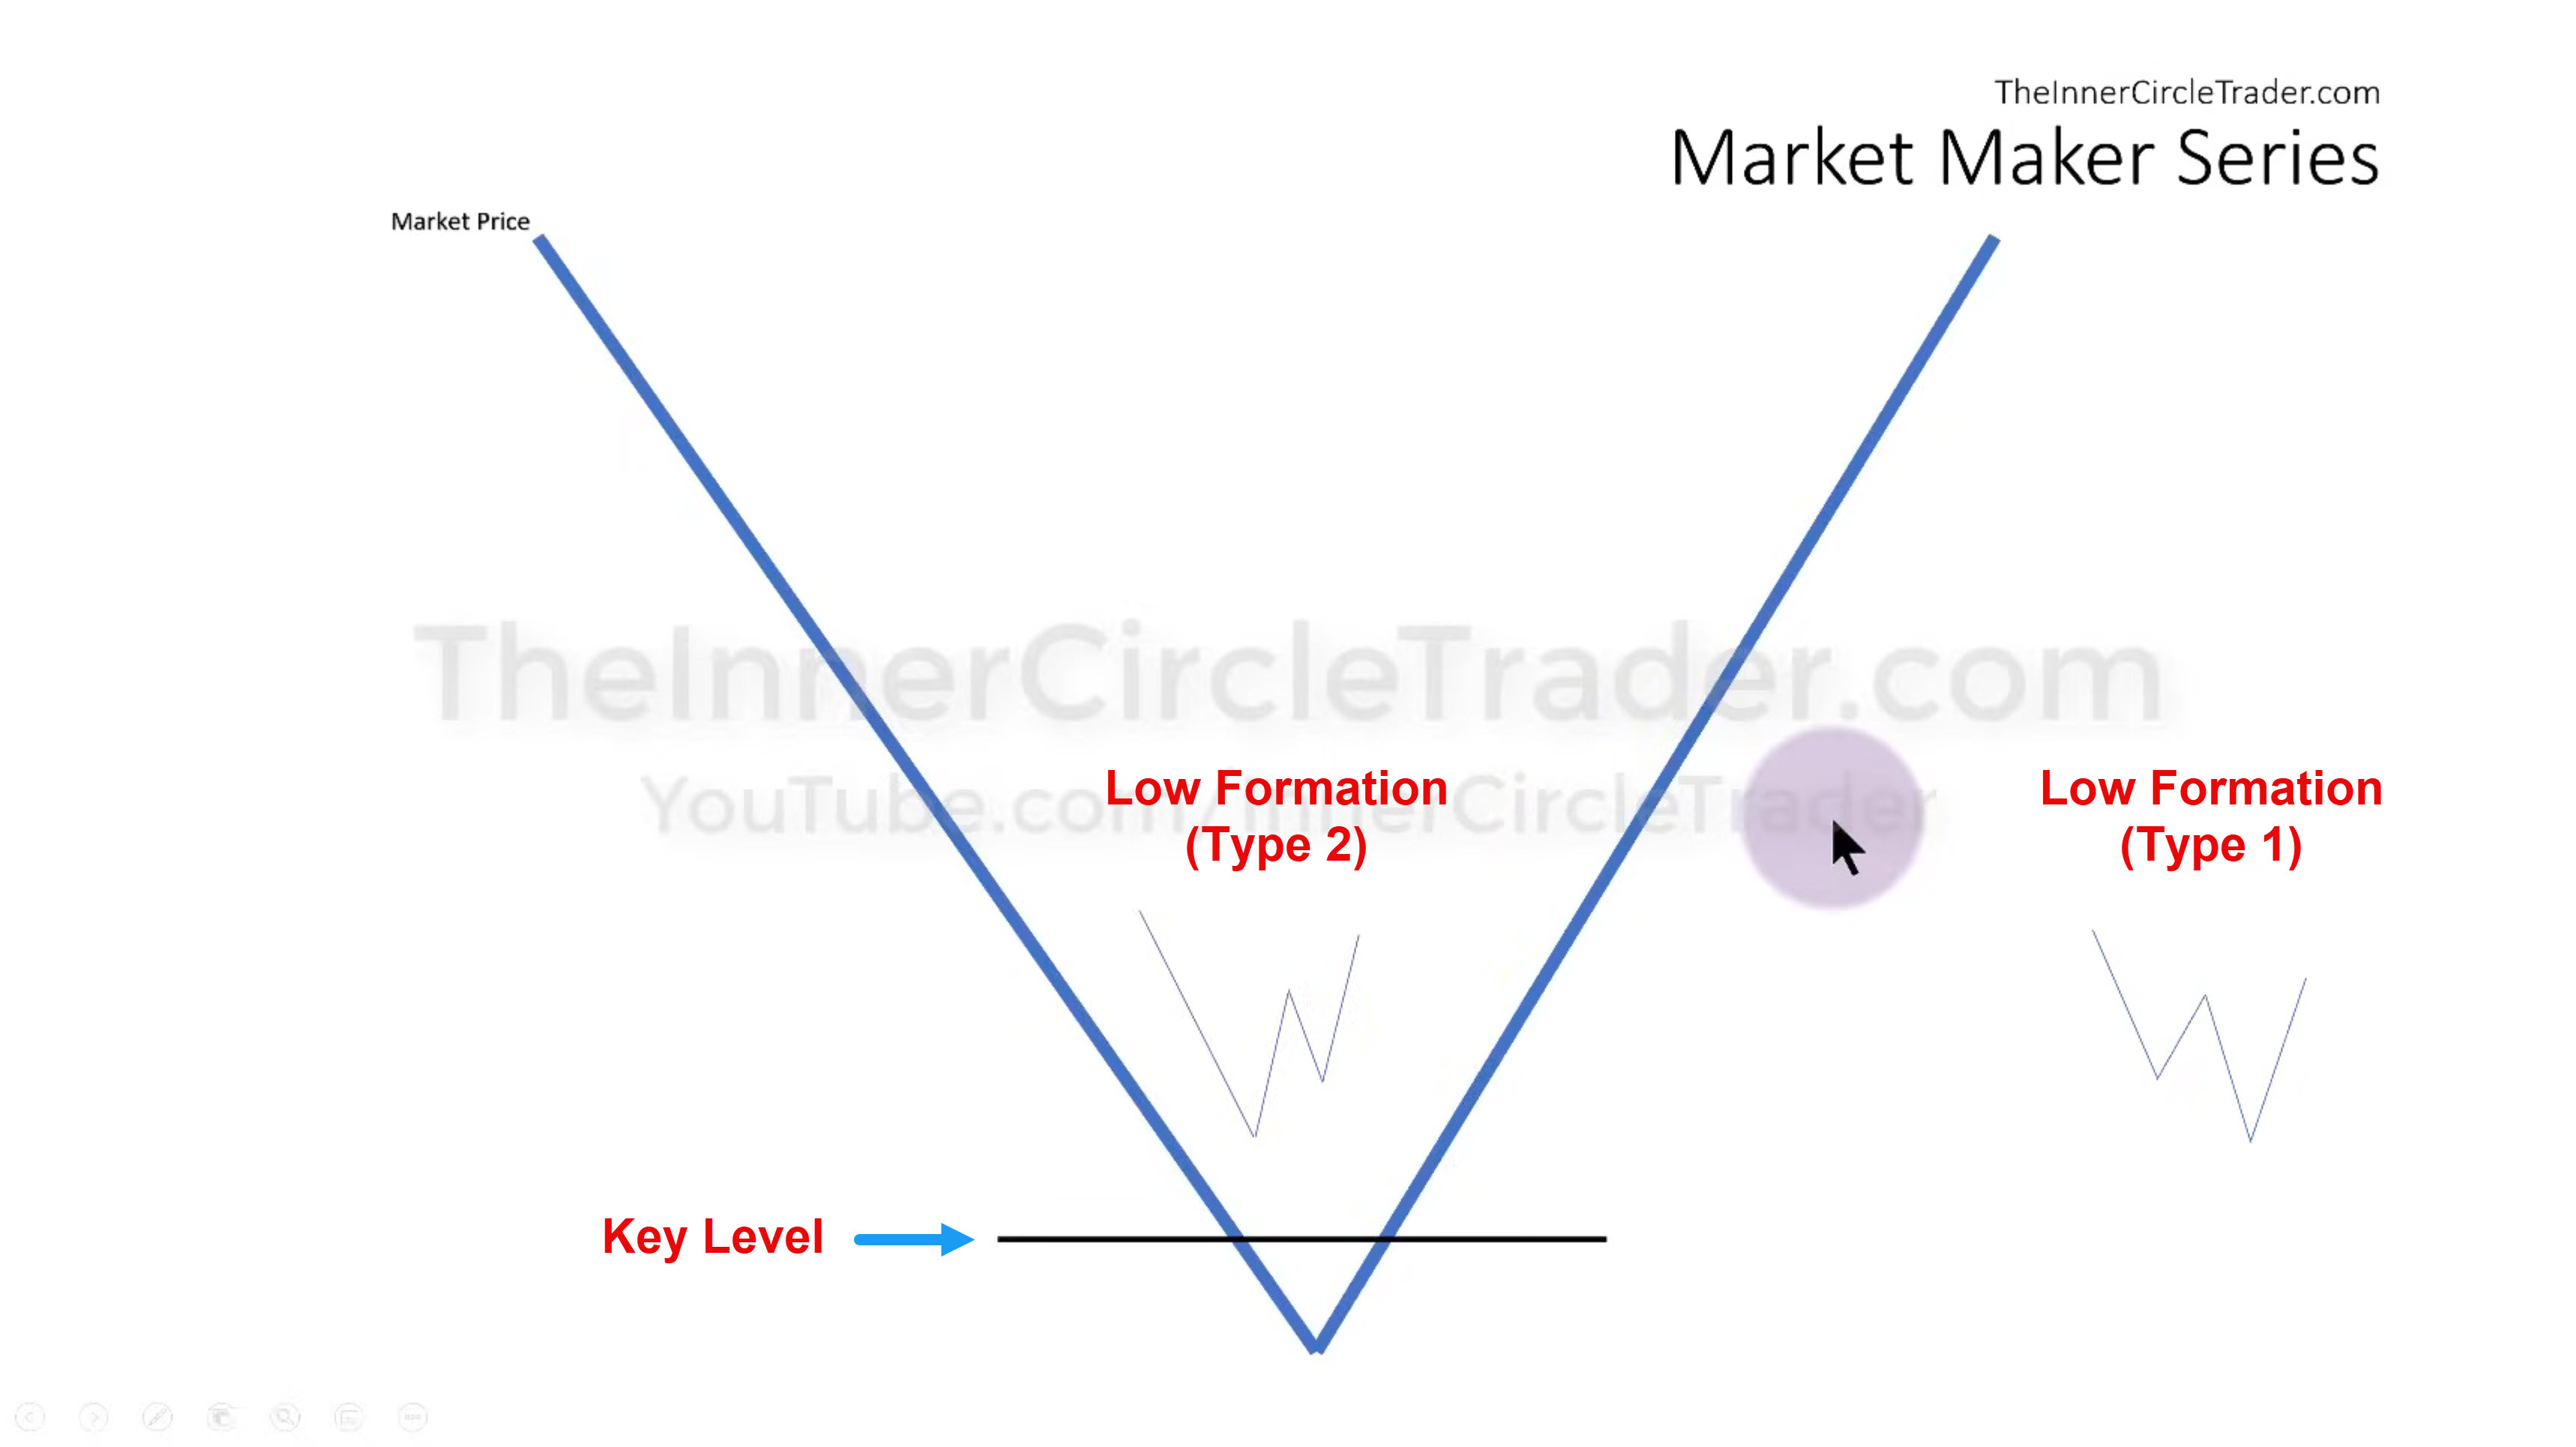
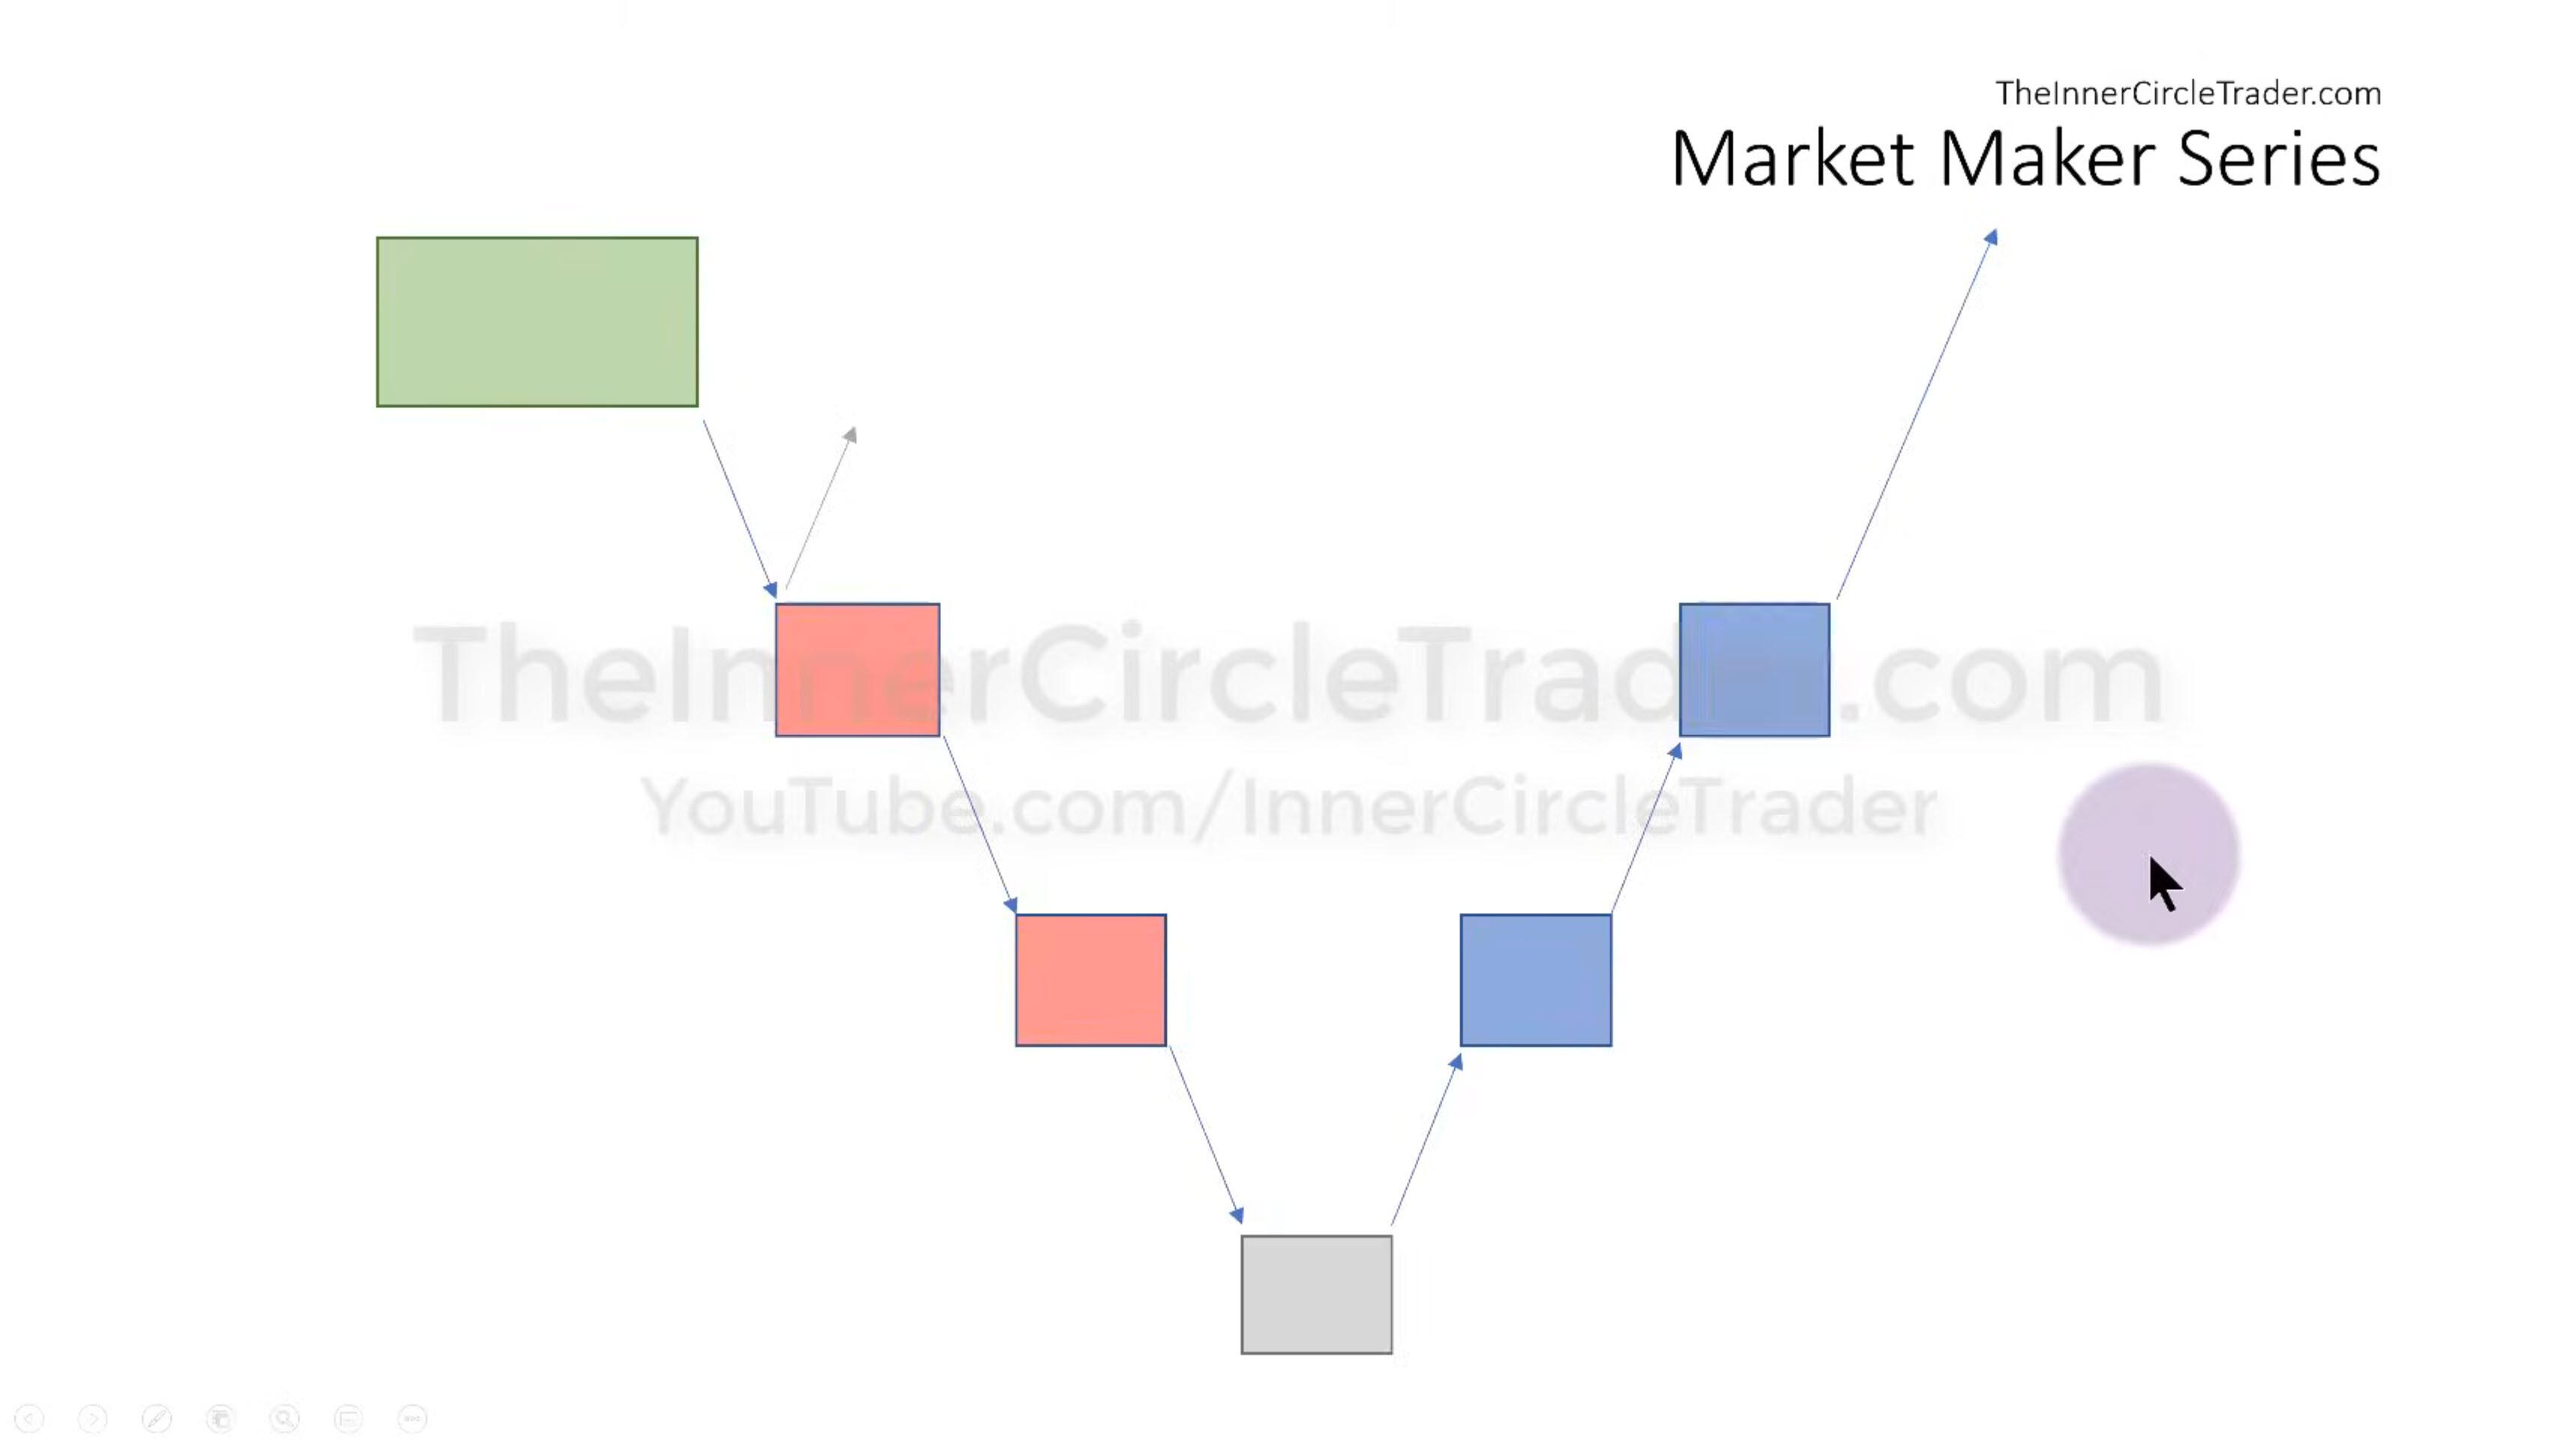
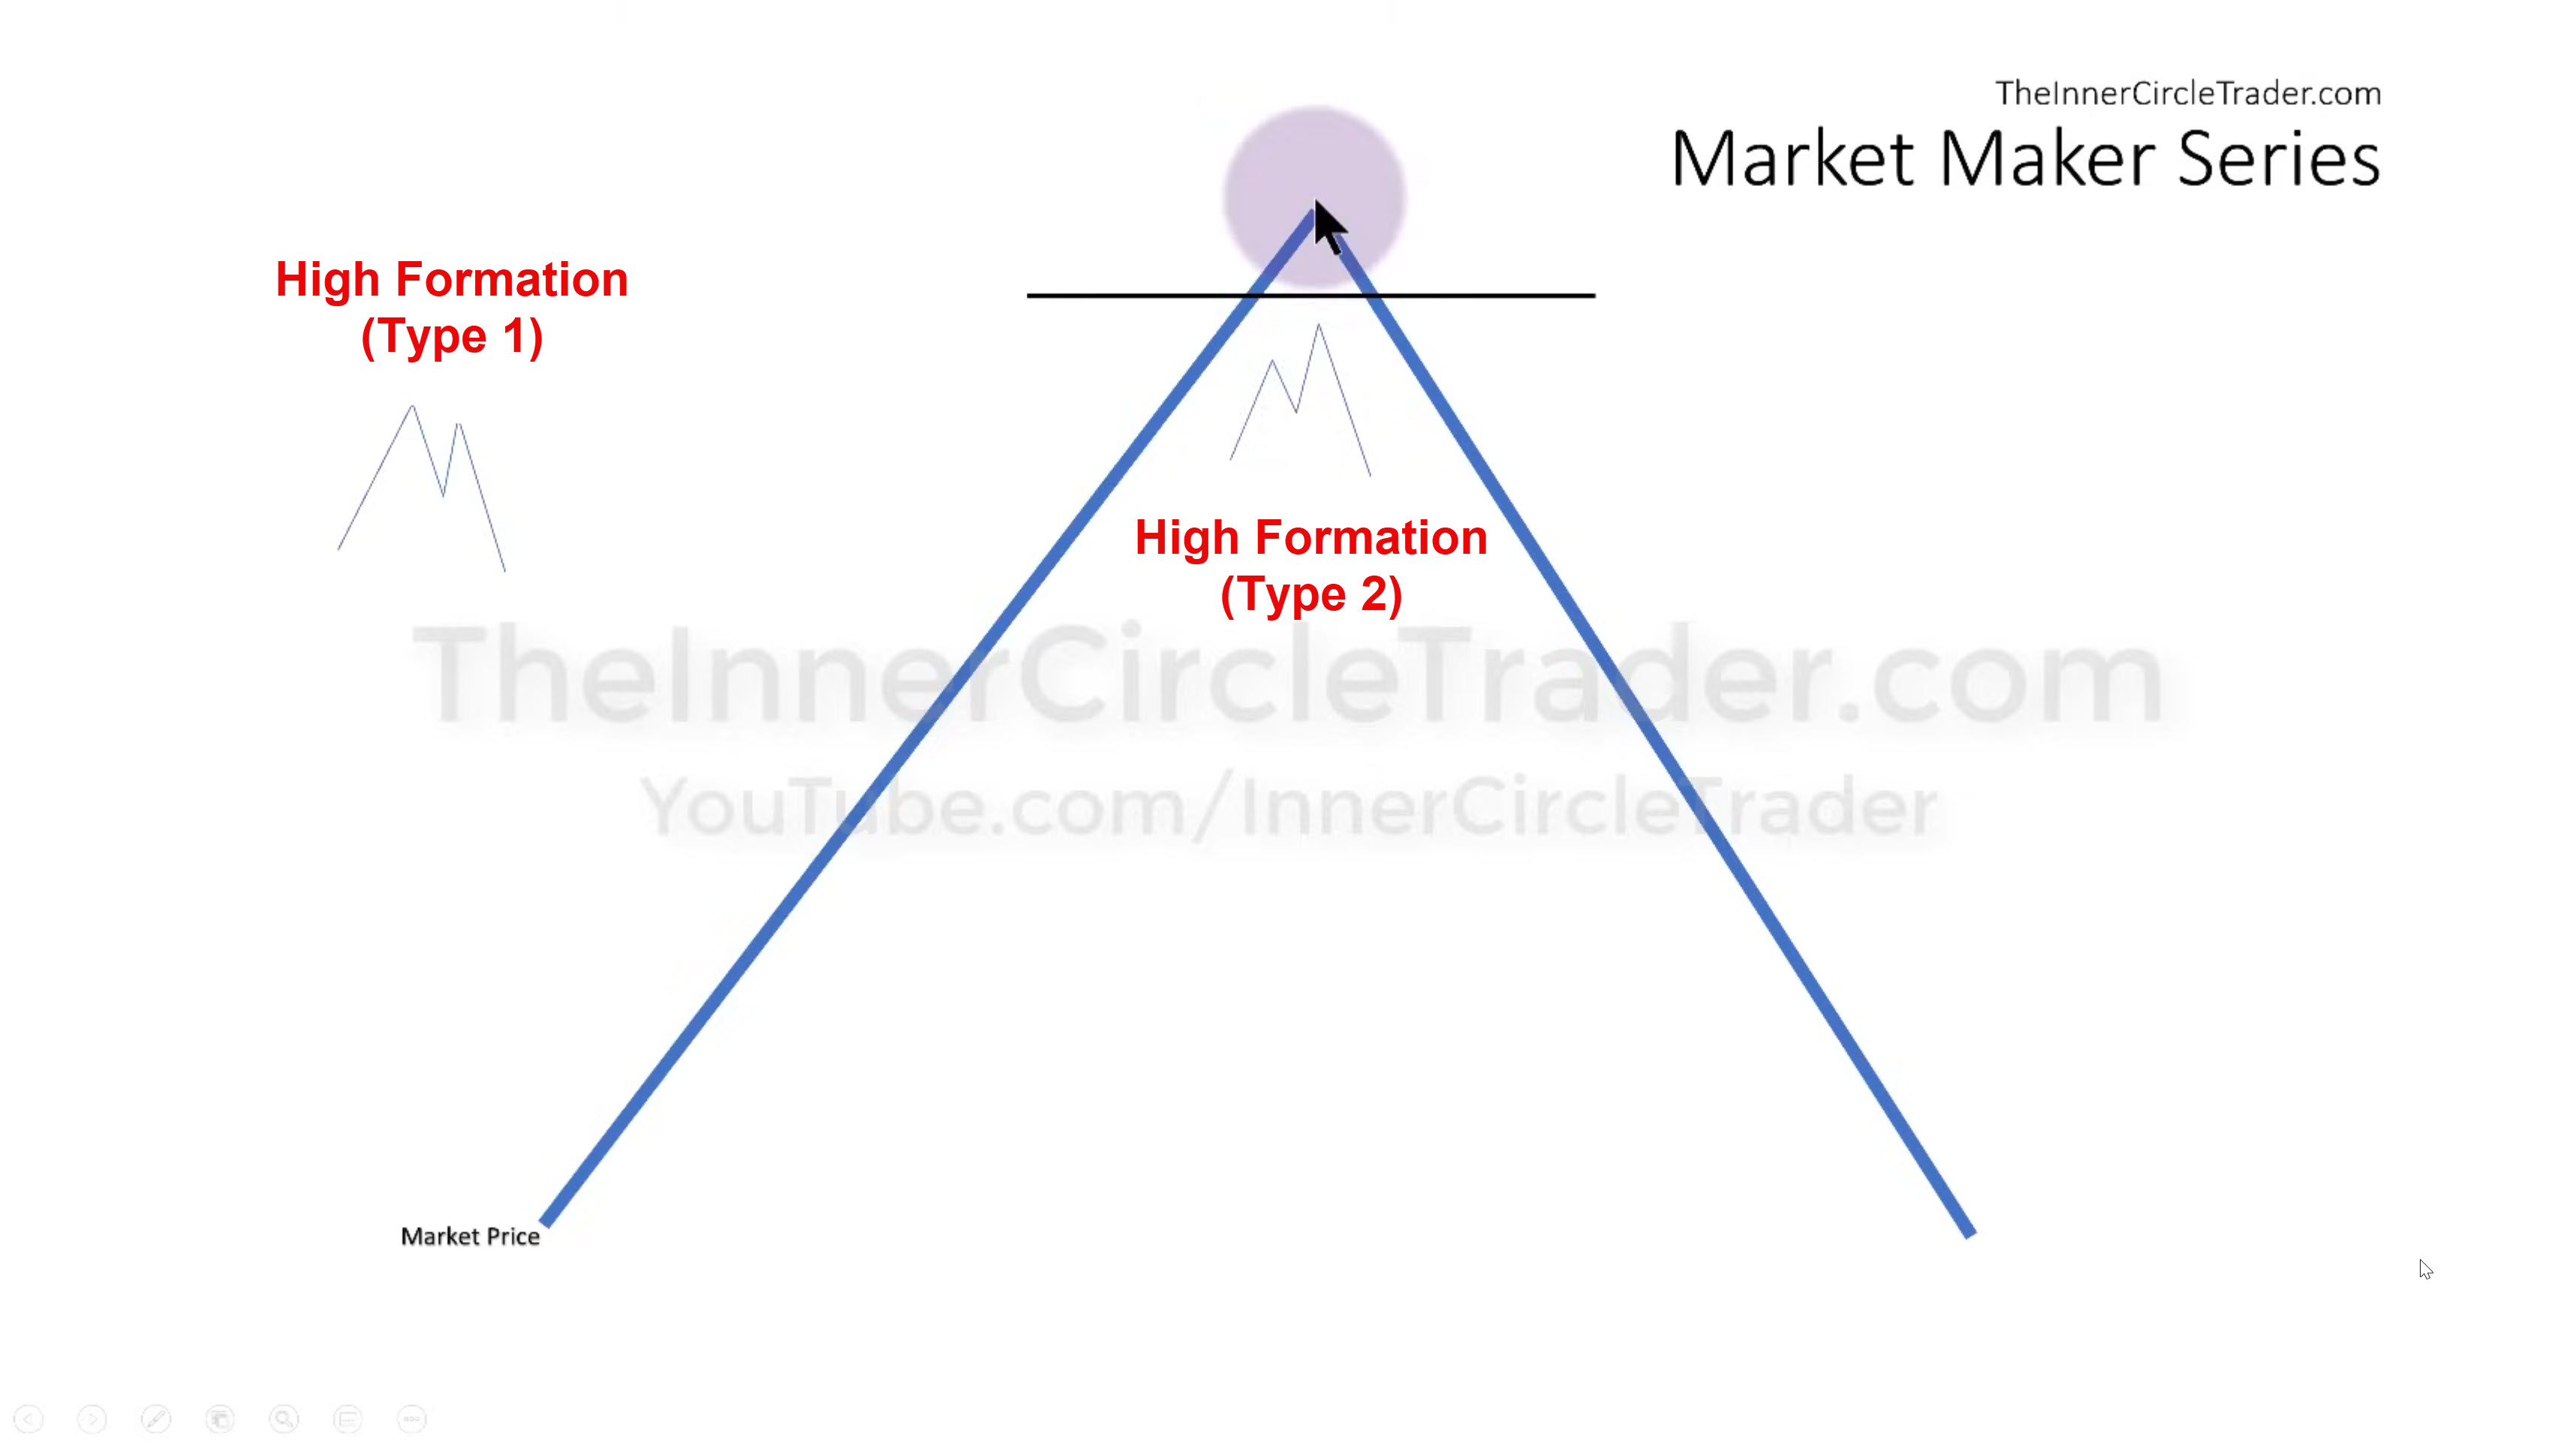
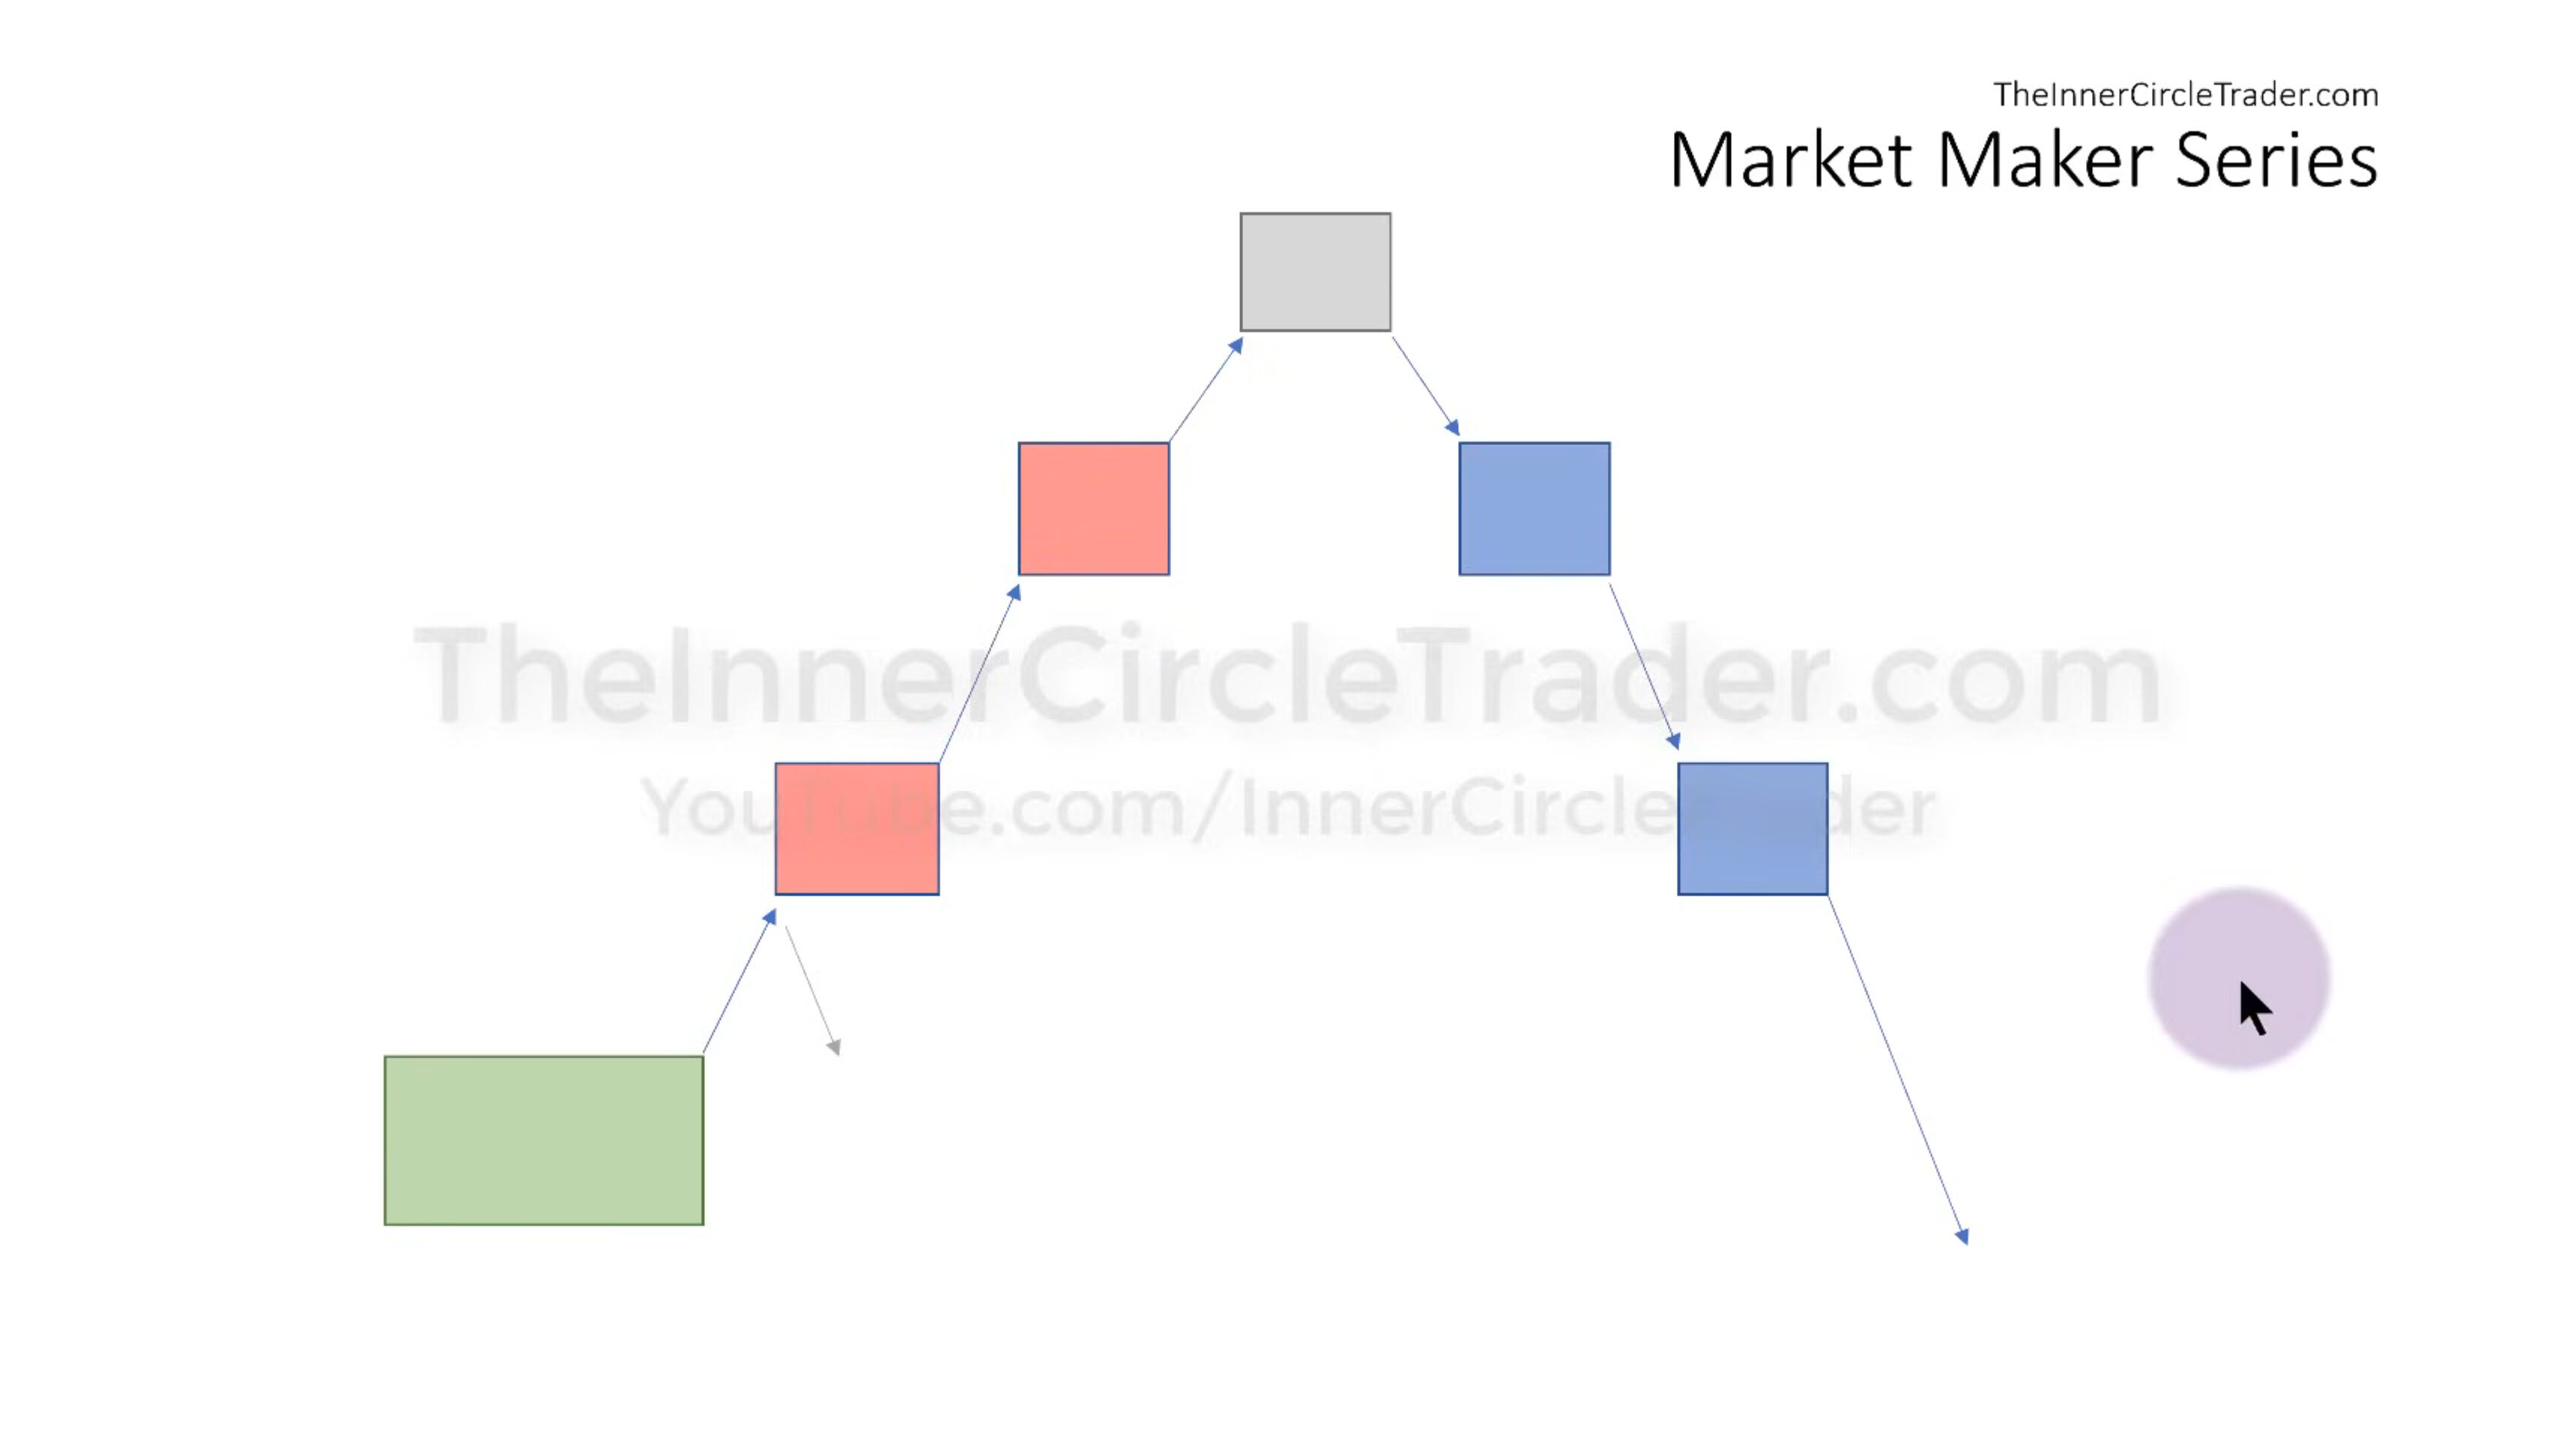
The MMXM model is nothing more than trading HTF pullbacks. This means you have to determine the current HTF trend, then wait for the LTF setup to form for your entry. Nothing more.
The MMXM model can also be traded when the market is moving sideways (so-called range-bound market trading). However, this is a more advanced matter and requires more experience.
Can you give me an example of how to perform an alignment?
If I have a daily HTF, I need to spend an hour looking for support for the directional trend. Once I have found something that supports the directional trend, I look for an entry time frame for the MMXM Model?
Thank you, I understand what I want, I can see it, but I lack the structure to see it. I thought that if I have a directional preference, then I have to use the MMXM model in the medium time frame, but since I understood it, I have to support the directional preference in the medium time frame and then look at the MMXM model in the execution time frame.
Thank you, brother, you are so great, I hope you get everything you want.
Bro, can you tell me if this is the right way to look at the MMXM model?
I just plot the directional slope on HTF and MID timeframes to support the directional slope, then I look at the entry timeframe to form the MMXM model, and then I enter the trade.
It looks good. Just keep in mind that markets only trend about 20 percent of the time. You won’t always be able to determine the HTF and MTTF, as the price may move sideways for some time.